Supporting organic and conventional farming through geospatial methods
SOCFARM is an international applied project of Uzbek–Hungarian cooperation. It combines Sentinel‑2, GIS, field spectrometry, soil and yield measurements to develop a methodology for assessing winter wheat condition, improving fertilizer and water management, and predicting yield.
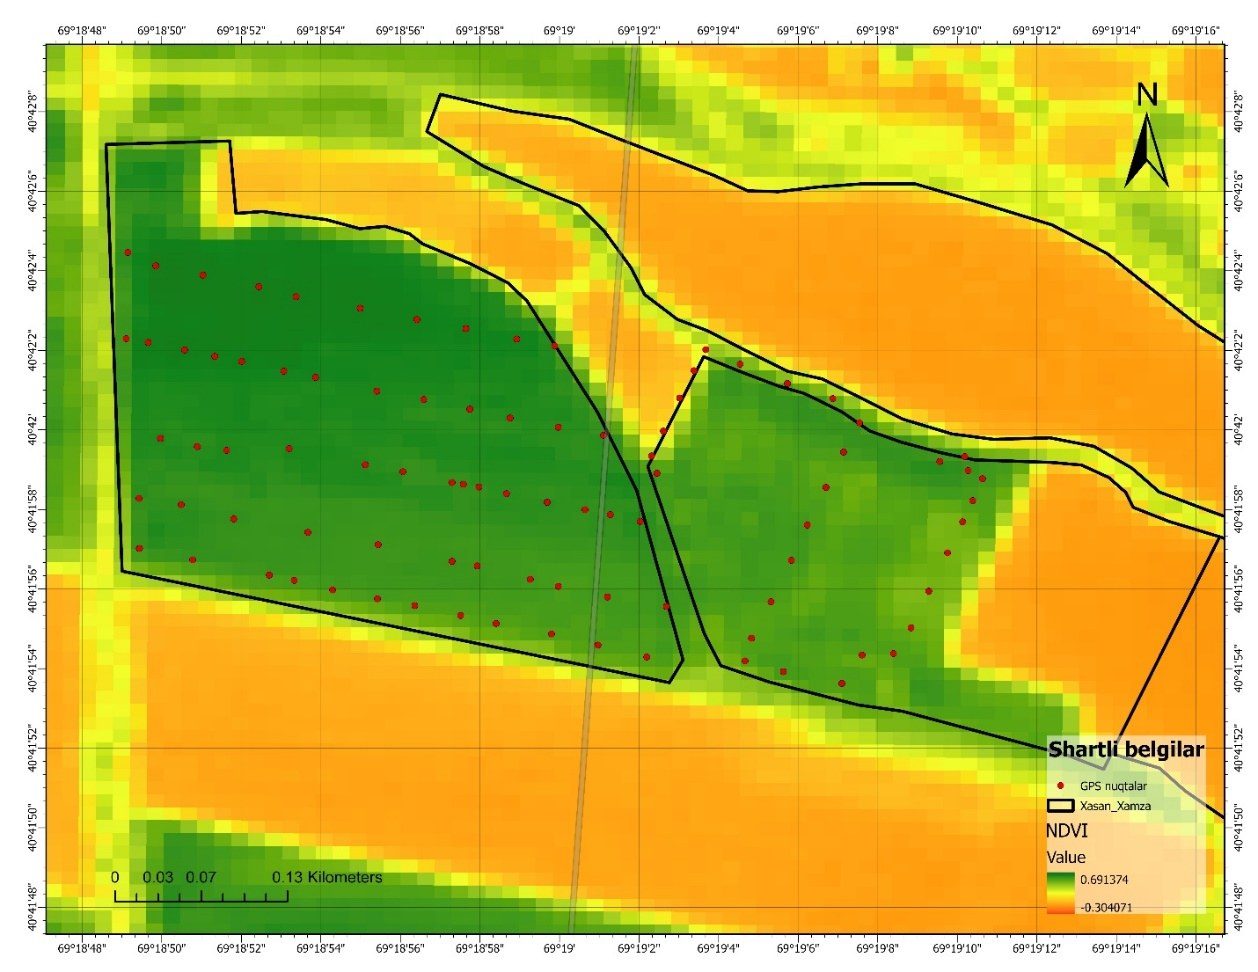
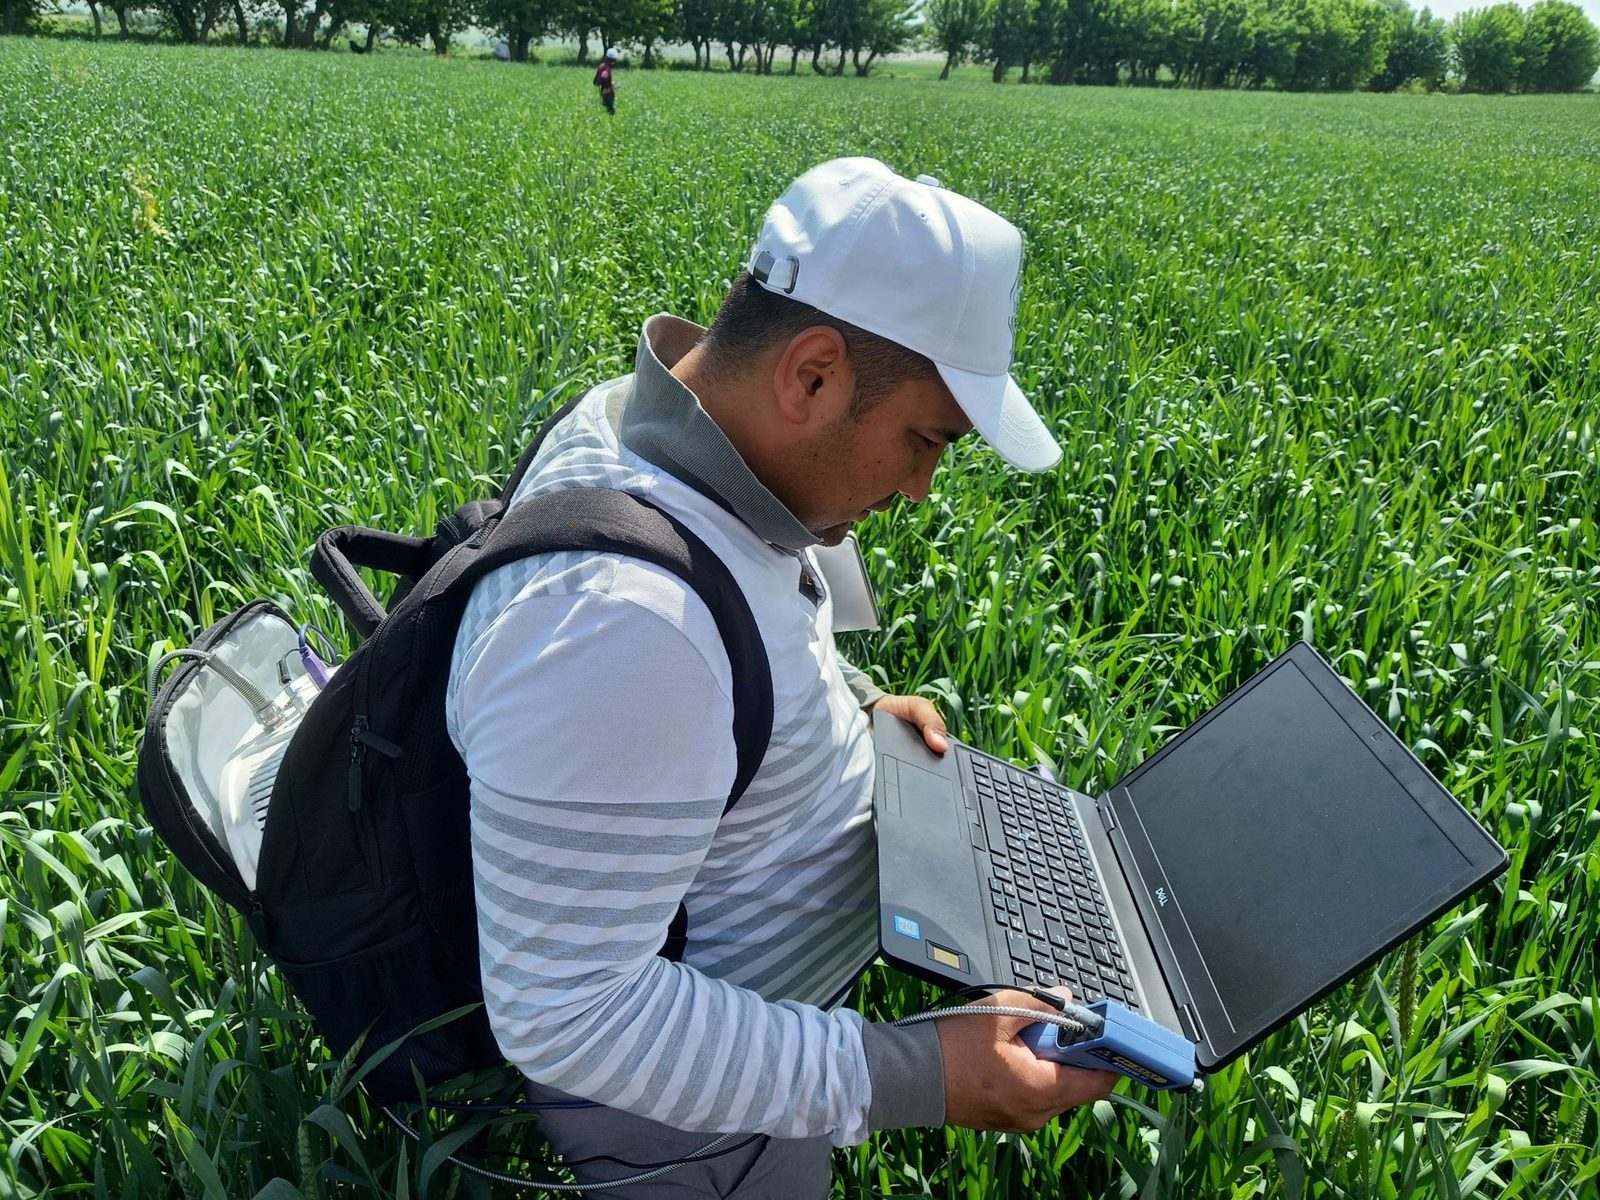
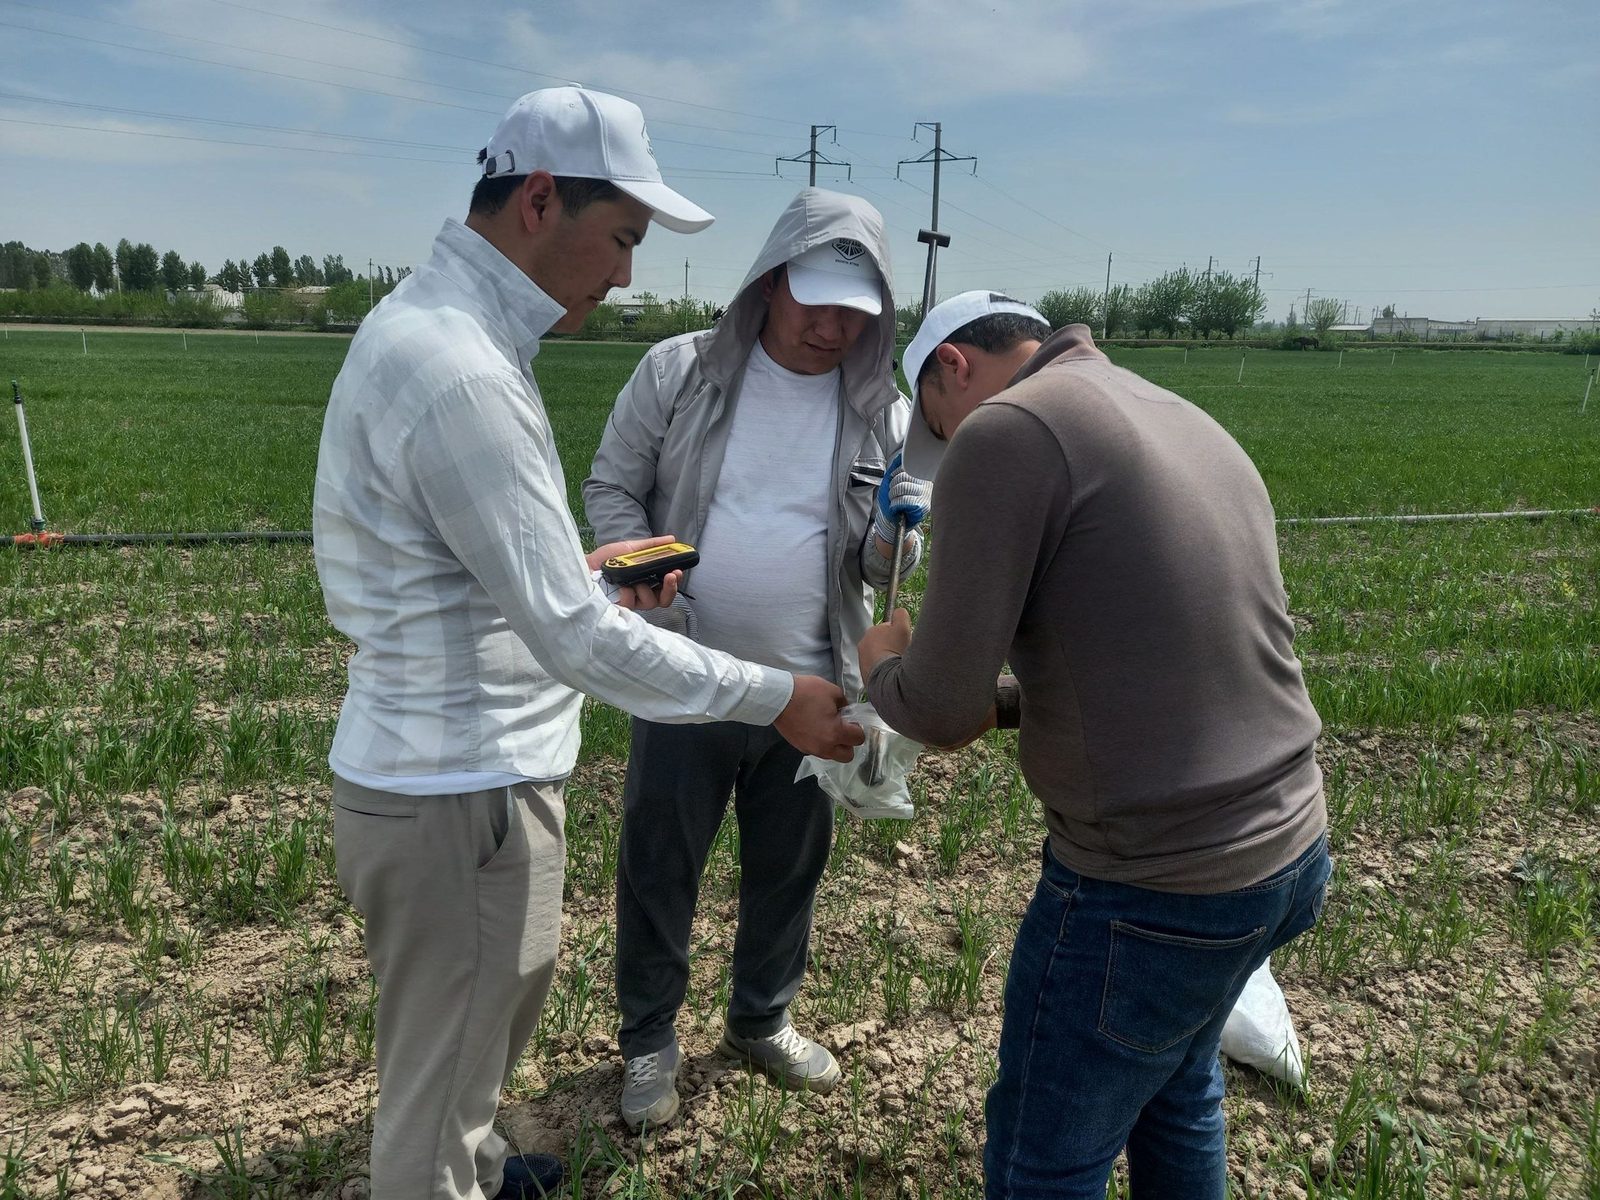 Sentinel‑2 vegetation status and fieldwork
Project passport and goals
The practical problem addressed
Three information gaps in field management were identified:
- Crop condition was assessed mostly by visual observation and experience; satellite monitoring was rarely used.
- Soil fertility data were outdated or insufficient; fertilizers were often applied at a uniform rate across the field.
- A locally validated methodology was lacking to justify irrigation timing, yield forecasting and management zones.
Farmers asked for simple, mobile-friendly maps and decision support. These needs shaped the project workflow: diagnostics → monitoring → prediction → web dissemination.
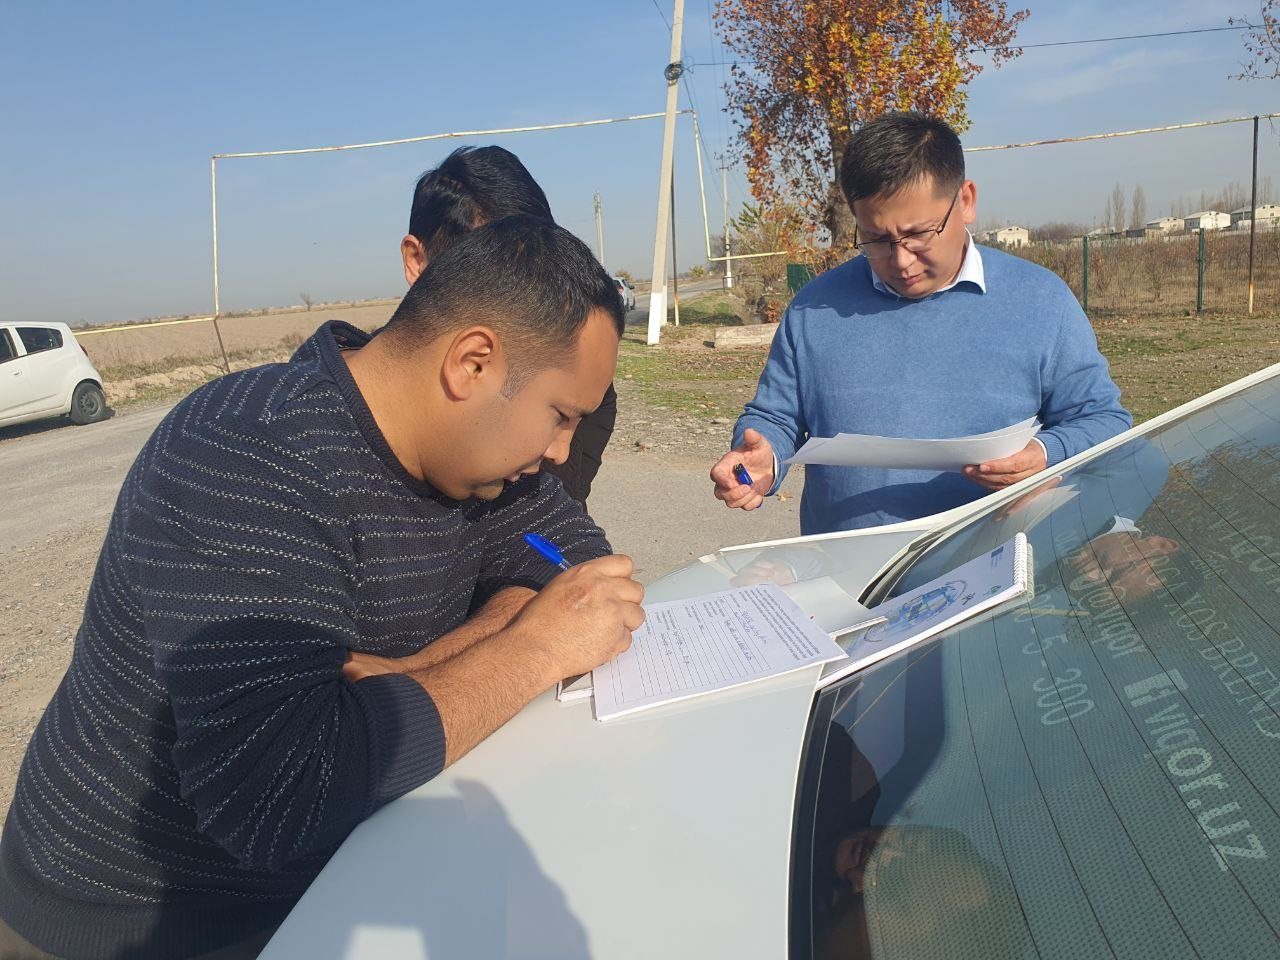
To support organic and conventional farming with geospatial methods and develop a methodology for assessing crop condition, fertilizer and water demand, and yield from multi-source data.
Key objectives
Needs assessment and selection of trial fields
Field-journal monitoring of phenology, irrigation and fertilization
Measuring and mapping N, P, K, humus and moisture
Building a cereal spectral library with ATP9110
Computing Sentinel‑2 time series and vegetation indices
Collecting 1 m² yield samples and evaluating the ML model
Disseminating results via website, trainings and scientific publications
Complementary roles of the partners

TIIAME National Research University
- GIS and remote sensing
- Field, soil and yield measurements
- Sentinel‑2 and machine learning
- Conventional irrigated farming

University of Nyíregyháza
- Organic farming expertise
- Organic fertilizer and triticale trials
- Training and international conferences
- Joint publications and exchange of experience
Study areas
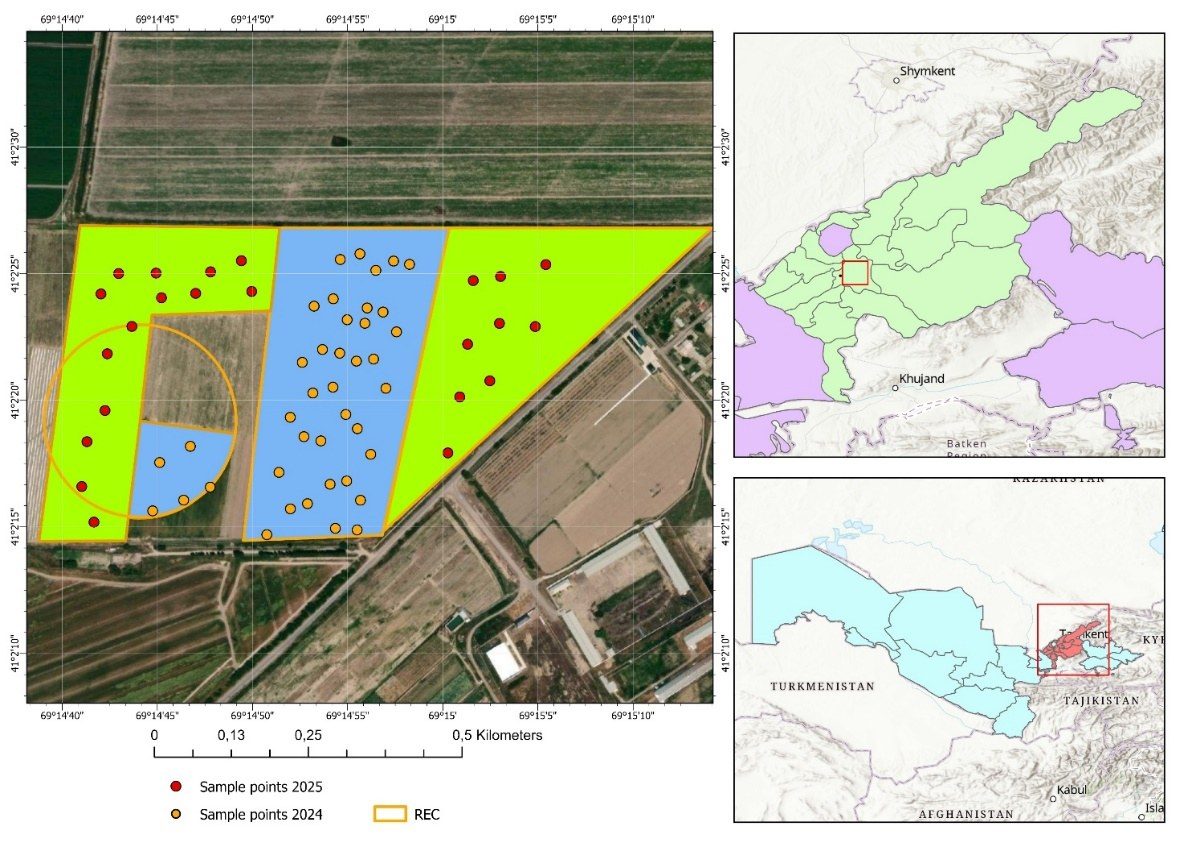
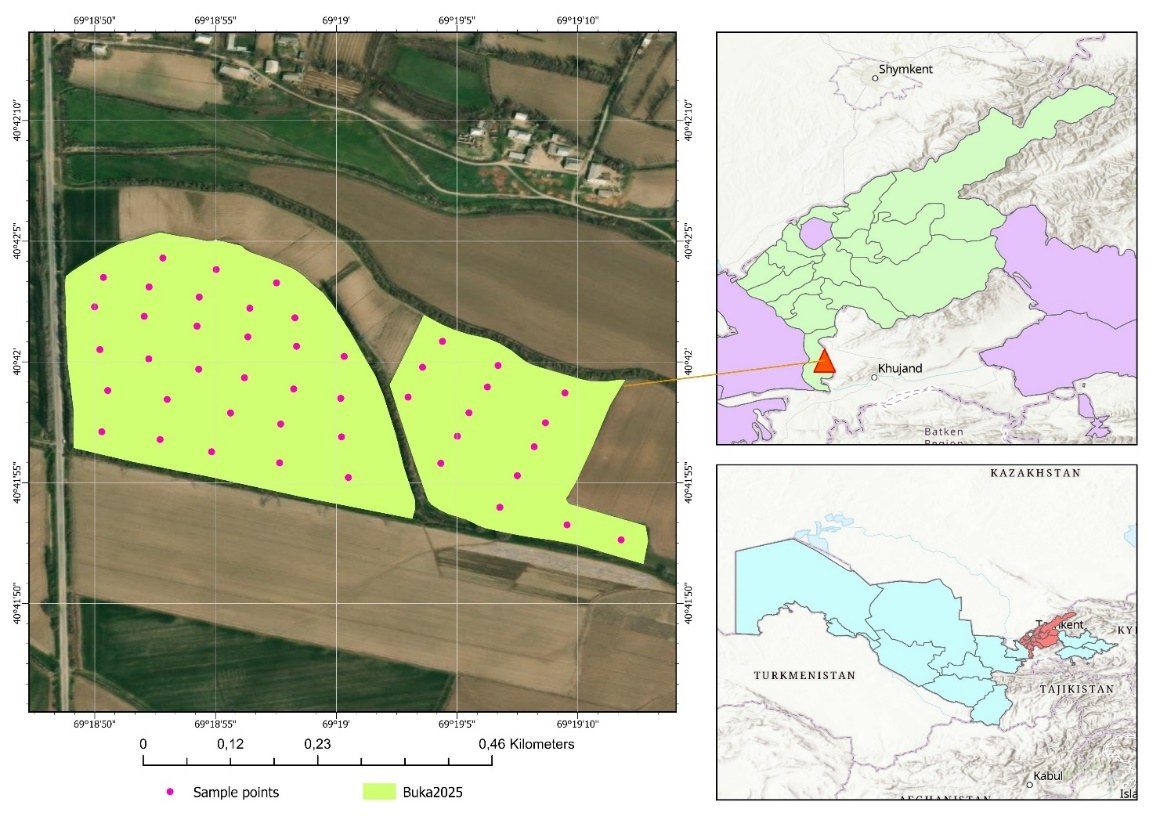
2025: sample segments of 10.07 ha / 13.8 ha · 2026: 39.8 ha / 8 fields, ≈69 ha
Scientific workflow
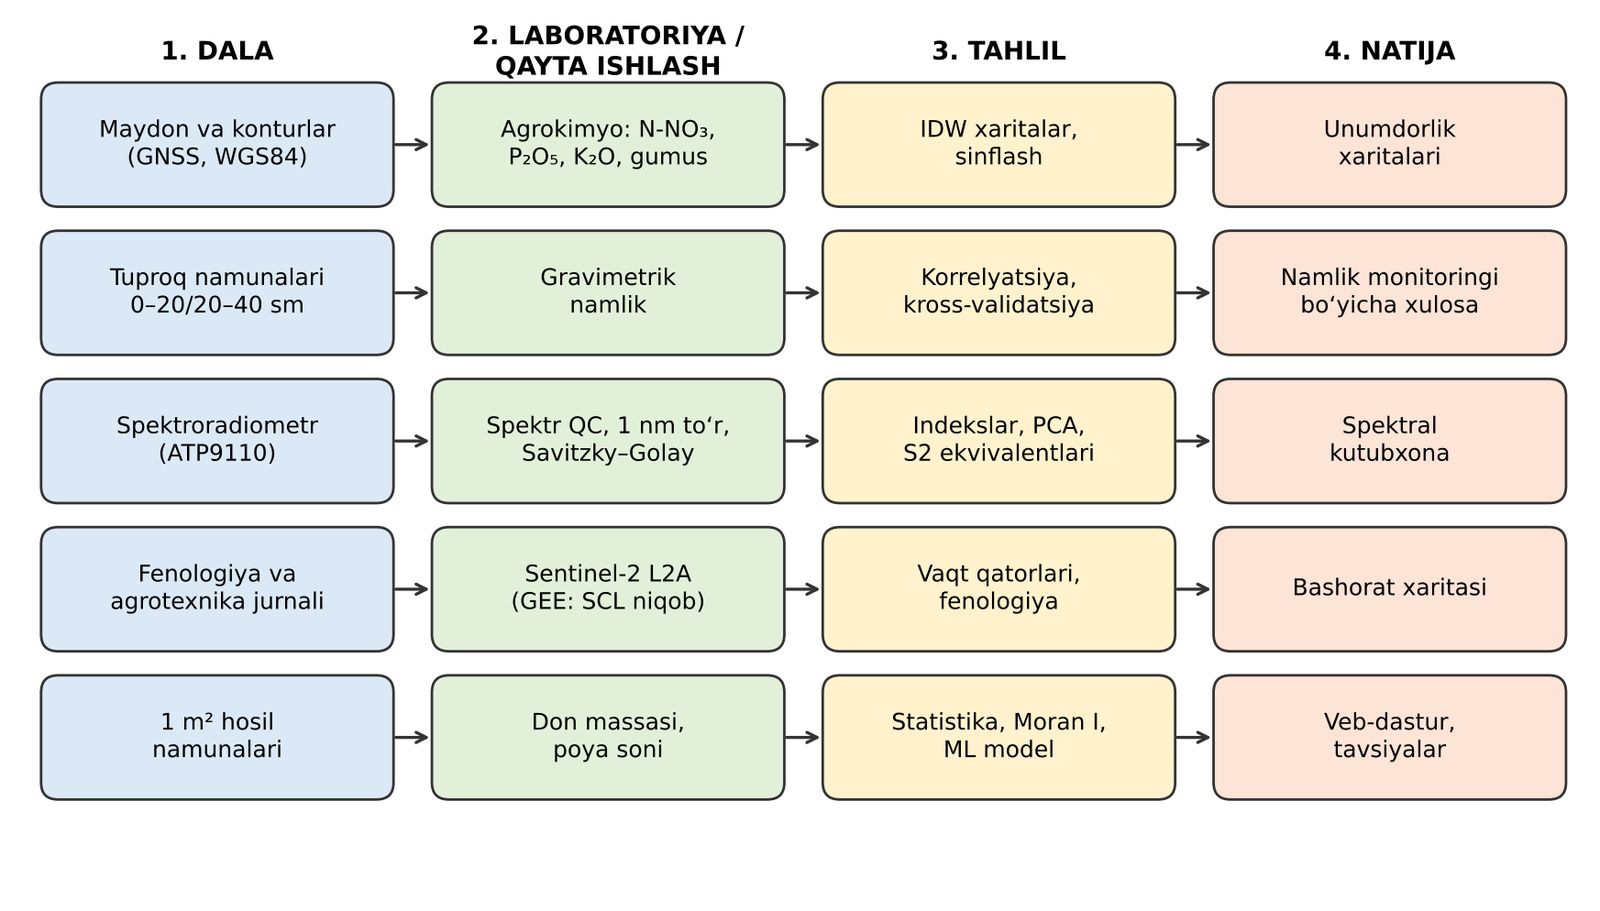
- All measurements at georeferenced points
- Field–lab–Sentinel‑2 linkage through a common ID
- Quality control: duplicates, blanks, calibration, QC
- Model evaluation with grouped cross-validation
- Turning results into maps and web products
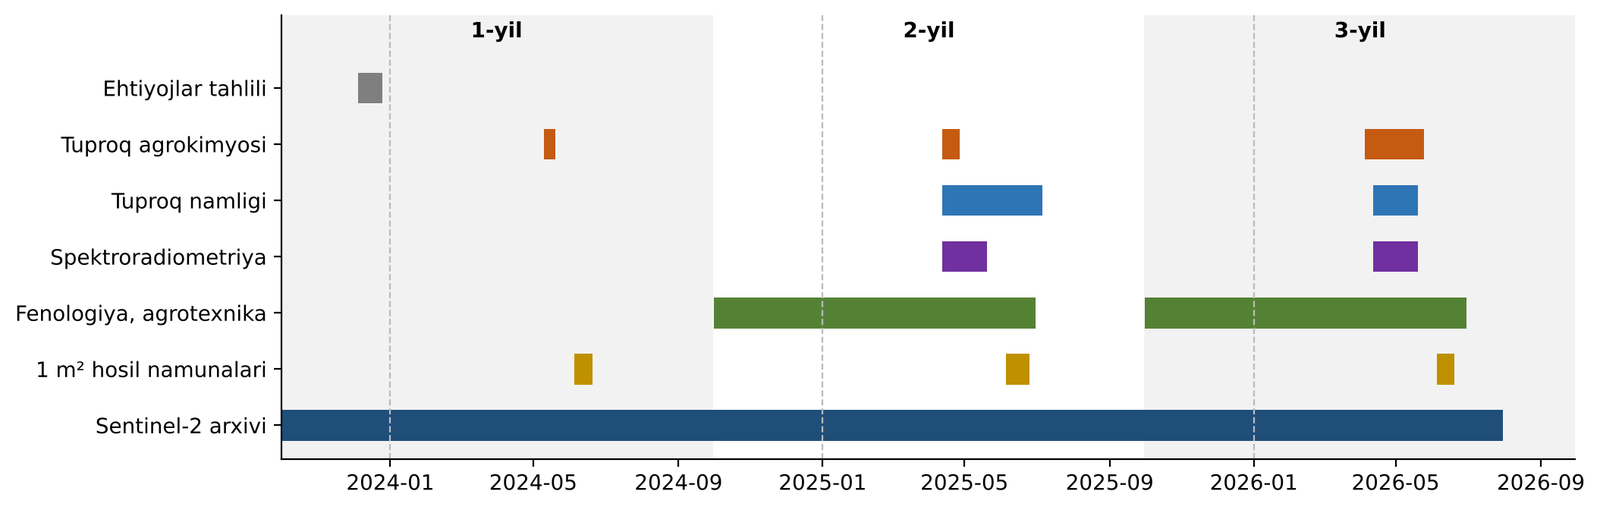
Field, laboratory and spectral measurements
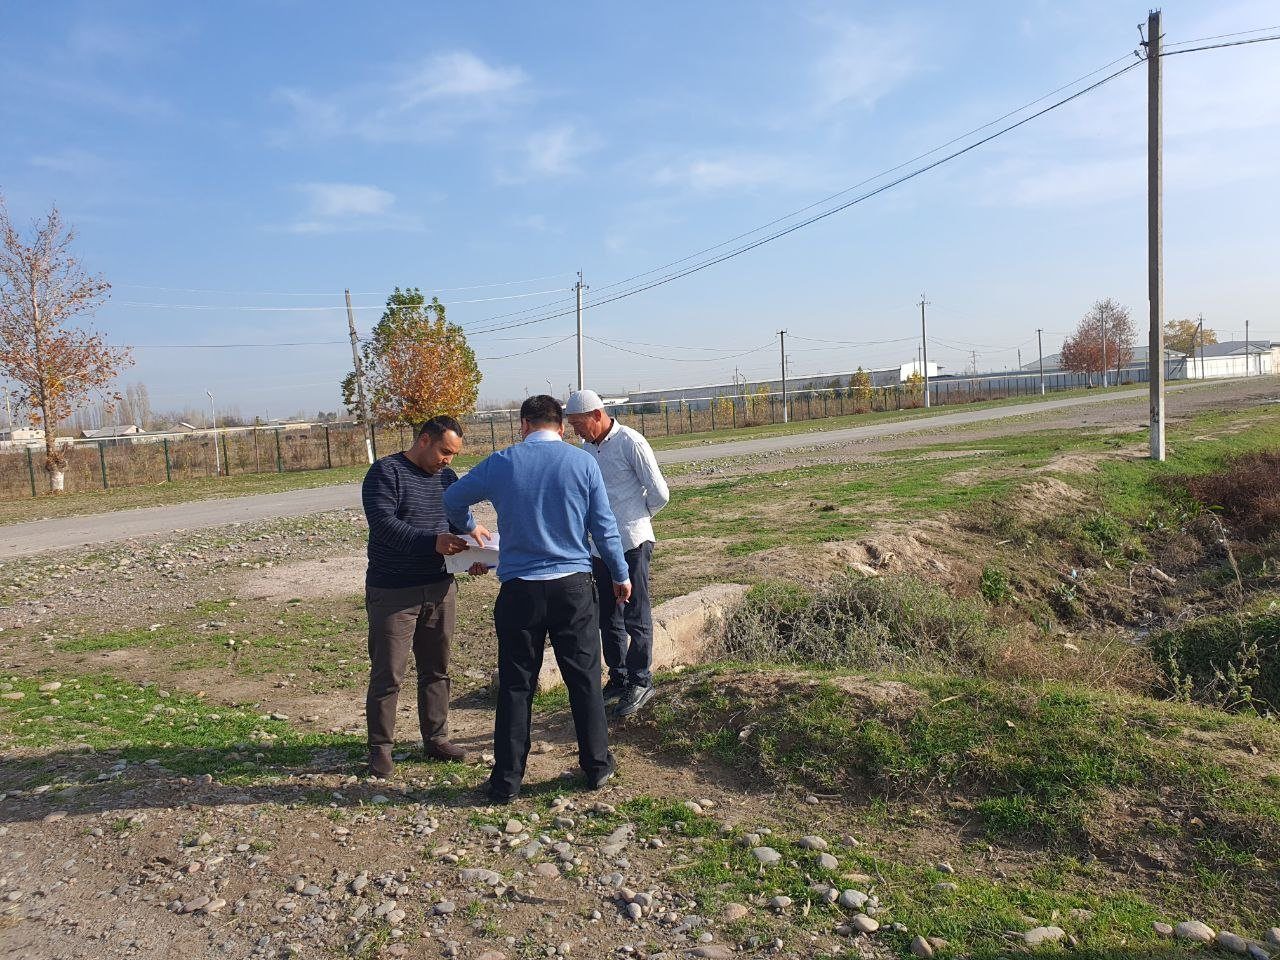
Stakeholder needs assessment
In December 2023, surveys and face-to-face interviews covered 5 farms and 28 questions: water and soil management, use of satellite monitoring, yield forecasting and economic potential, and interest in organic methods.
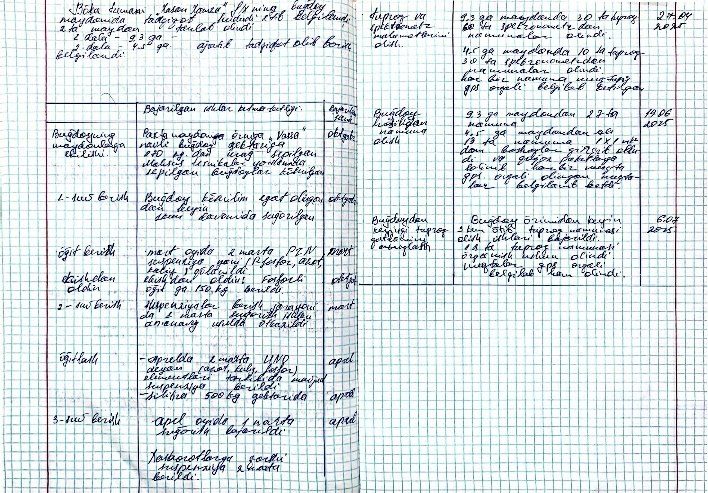
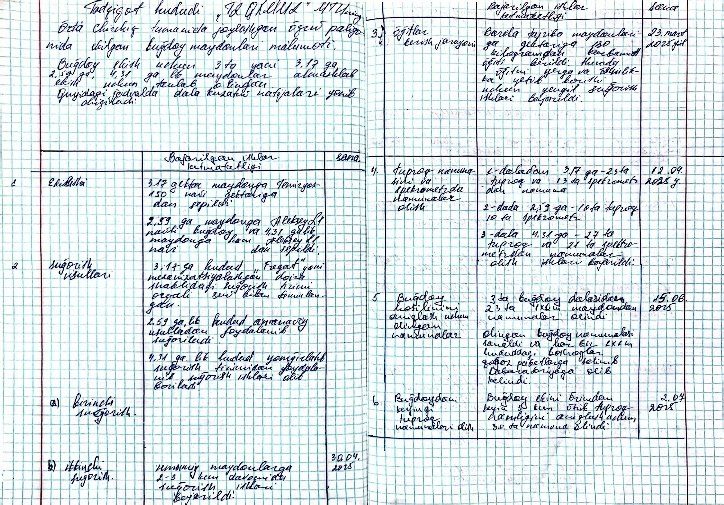
Phenological and agrotechnical observations
The field journal consistently recorded irrigation, fertilization, crop protection and growth stages from sowing to harvest, season by season.
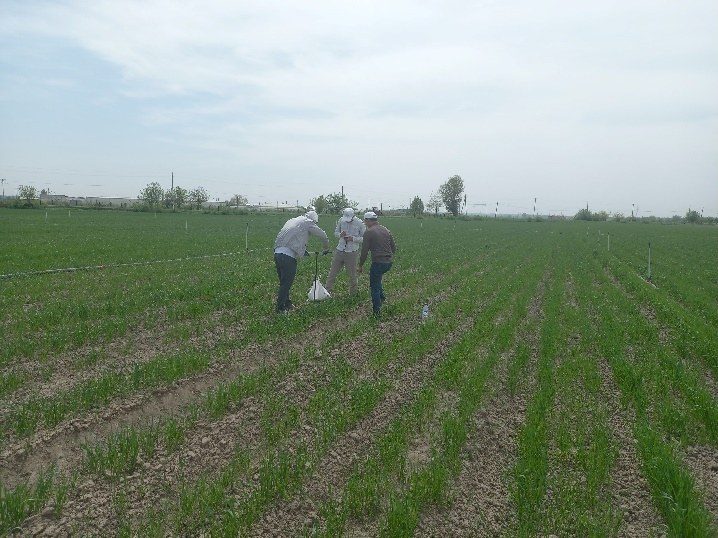
Soil sampling: 2024–2025
112 samples · WGS84 coordinates · duplicate and blank control · sample–lab–GIS consistency.
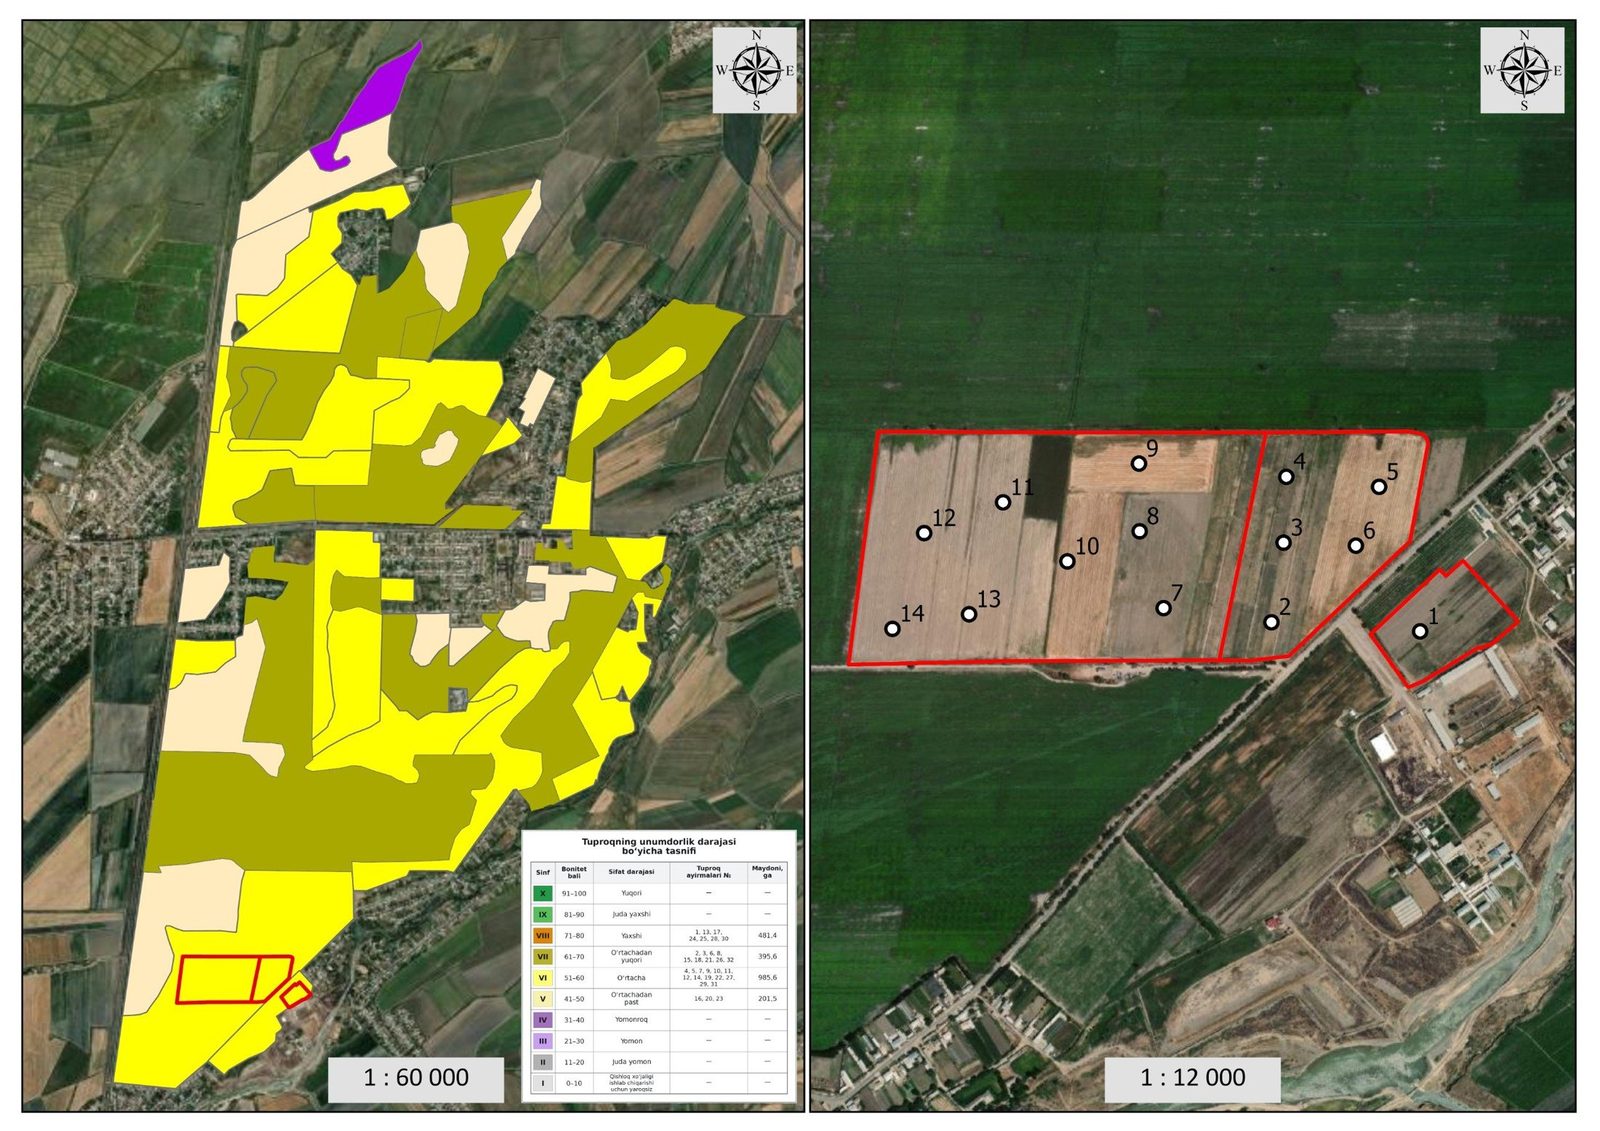
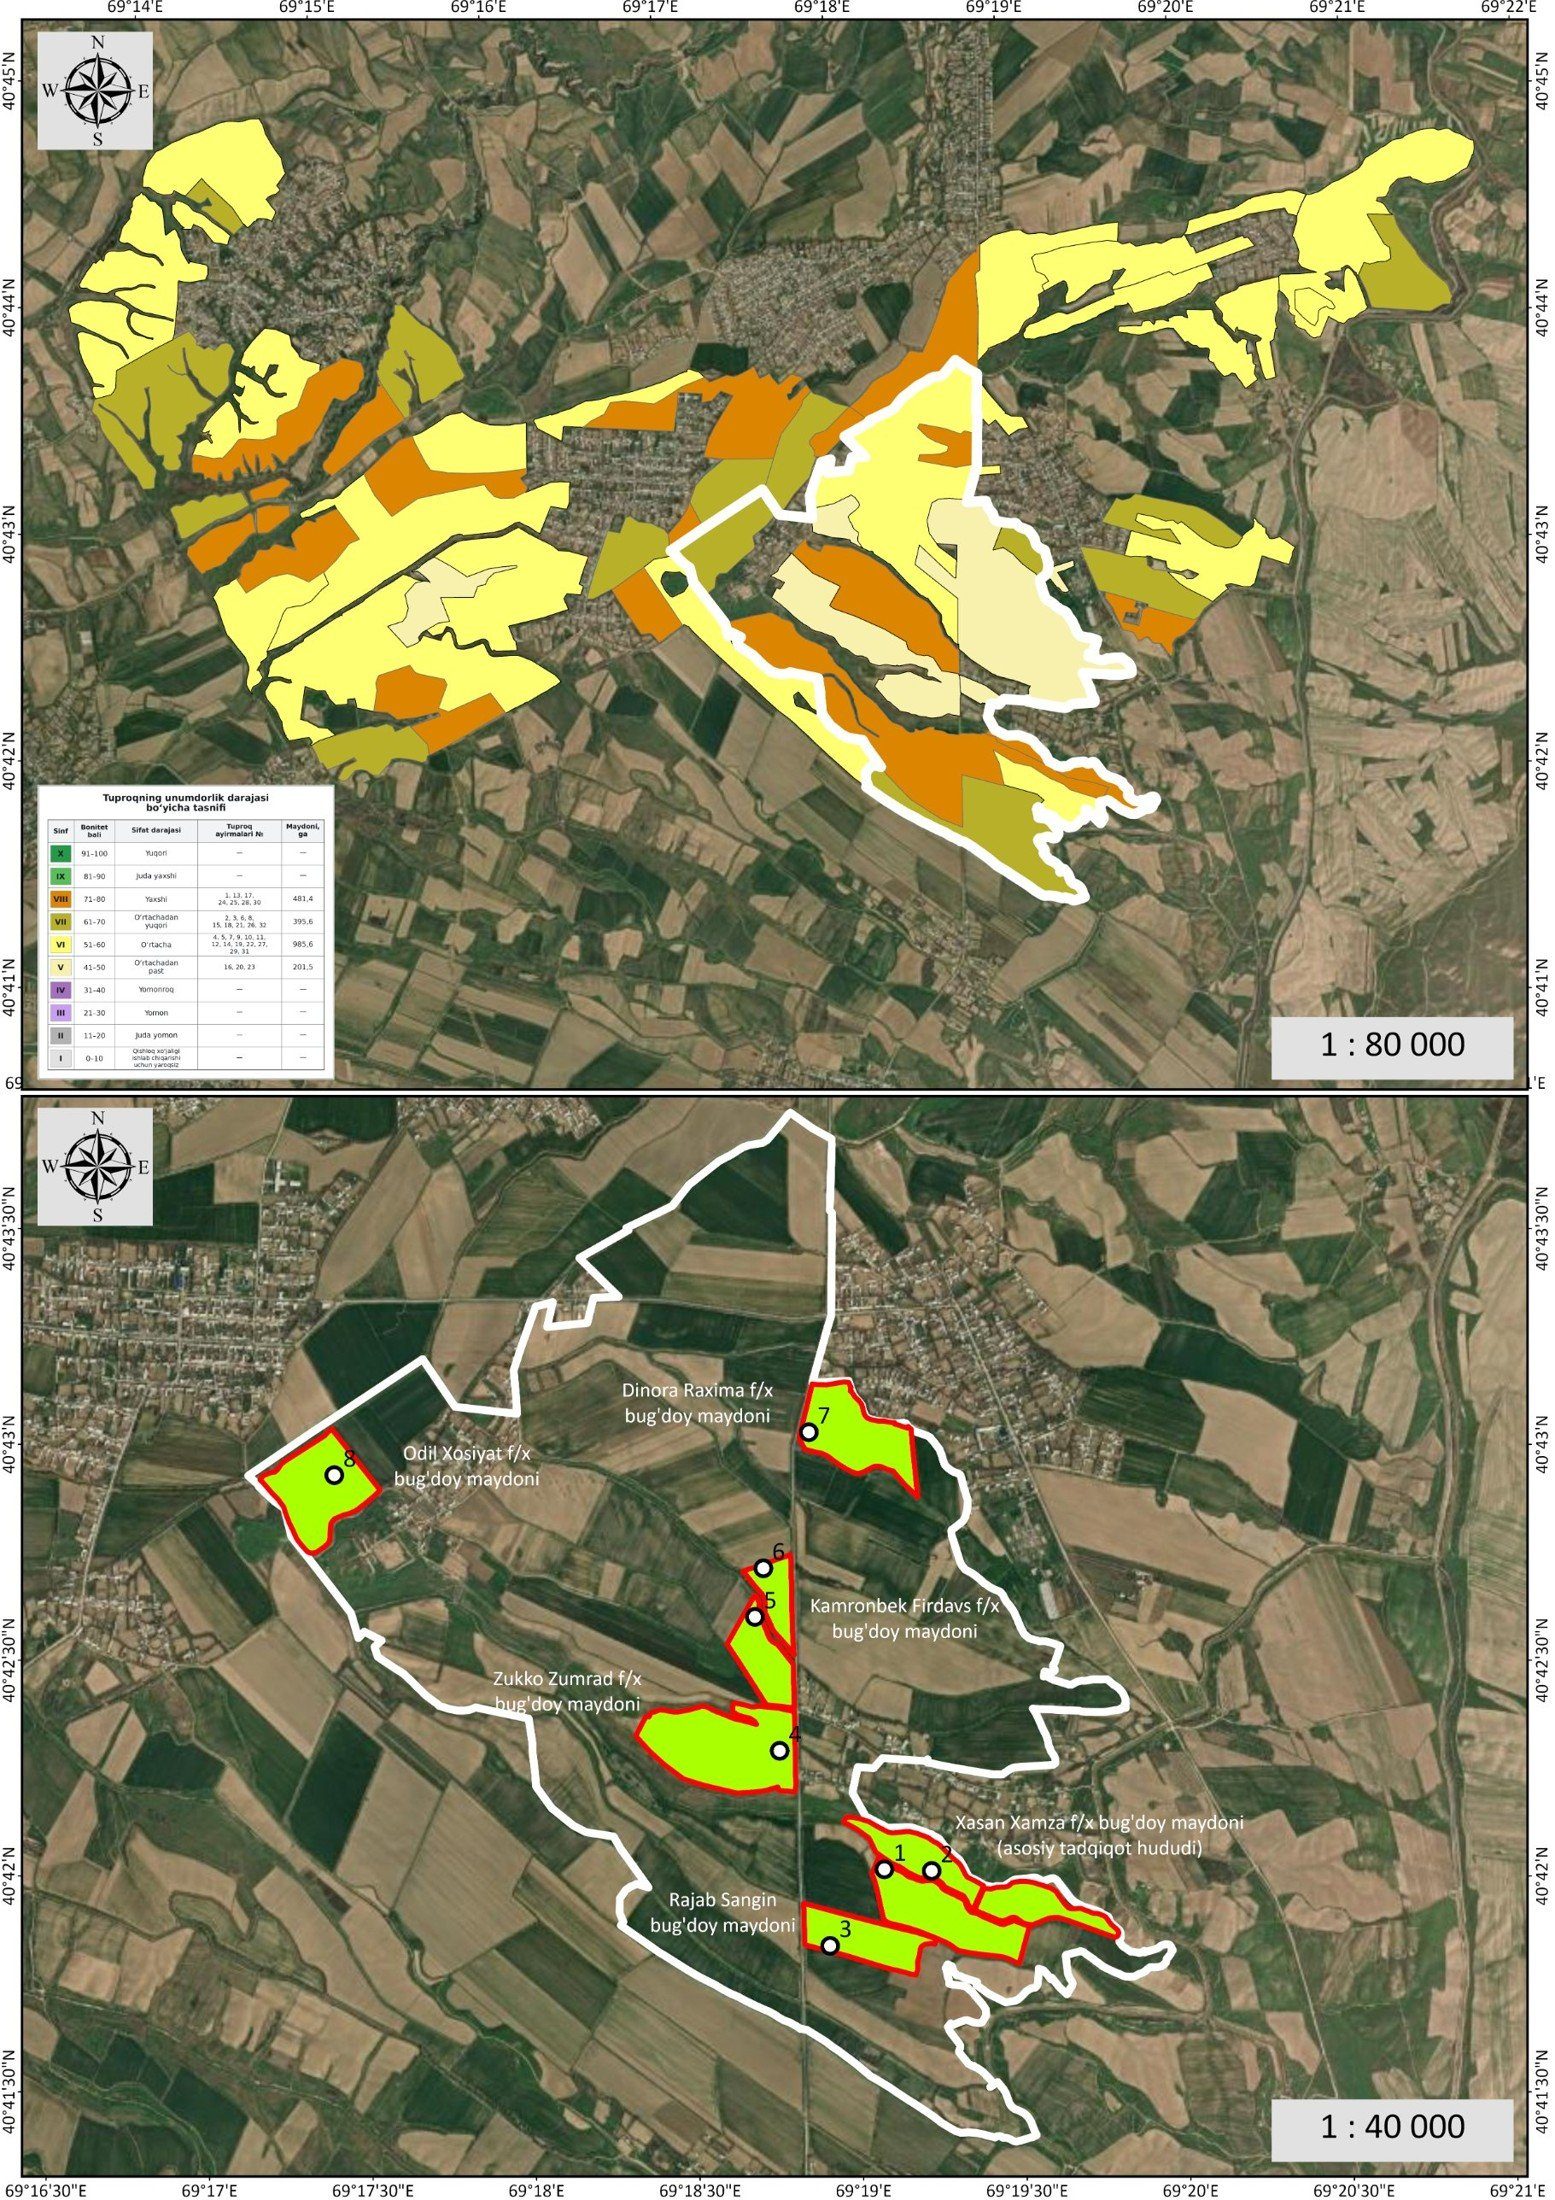
2026: soil profiles and area expansion
22 profiles × 2 layers. In Boka, 8 wheat fields of 6 farms were covered; in Middle Chirchiq, 39.8 ha of the university farm.
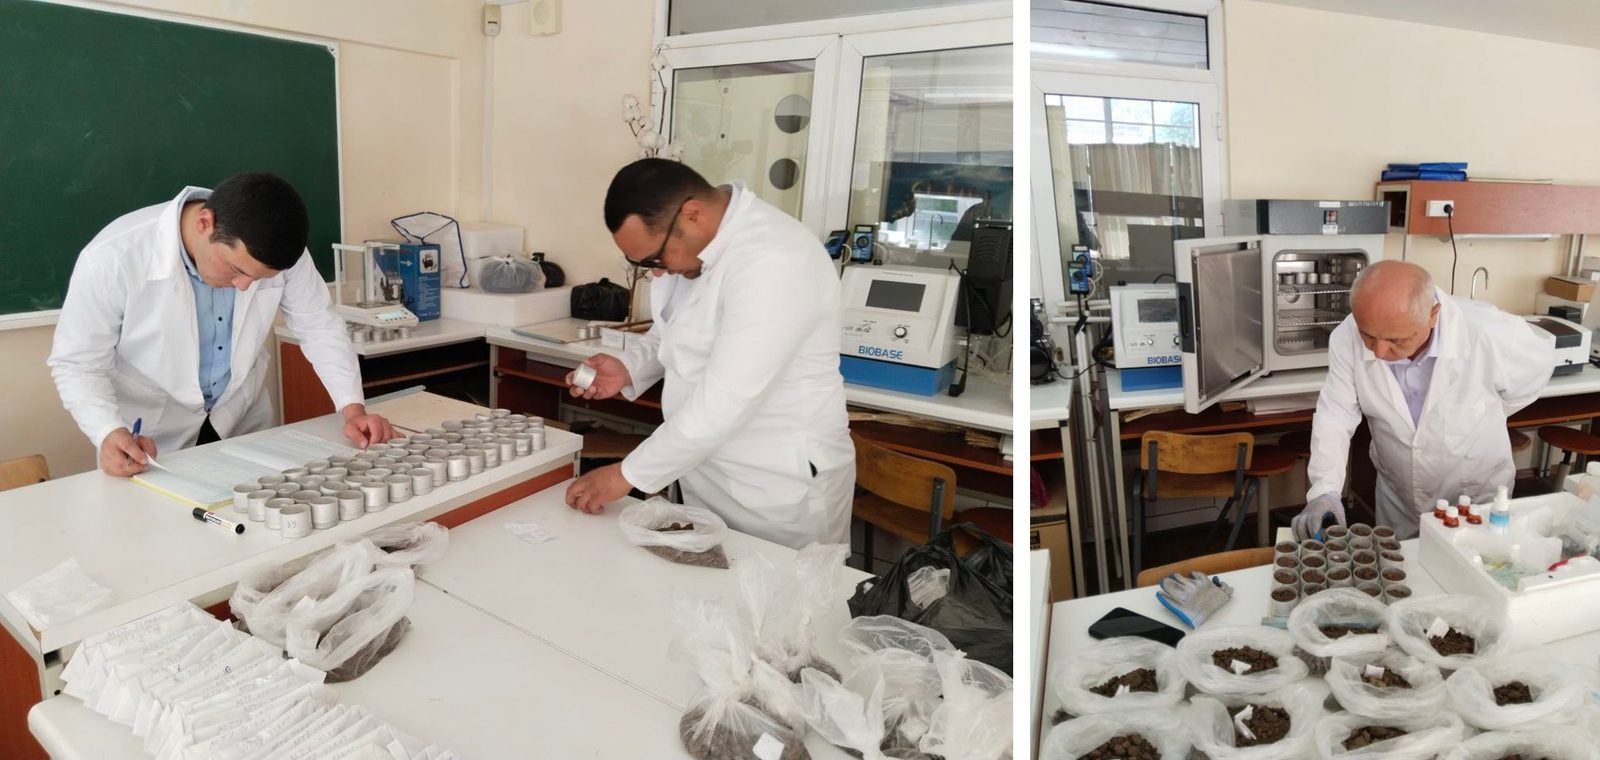
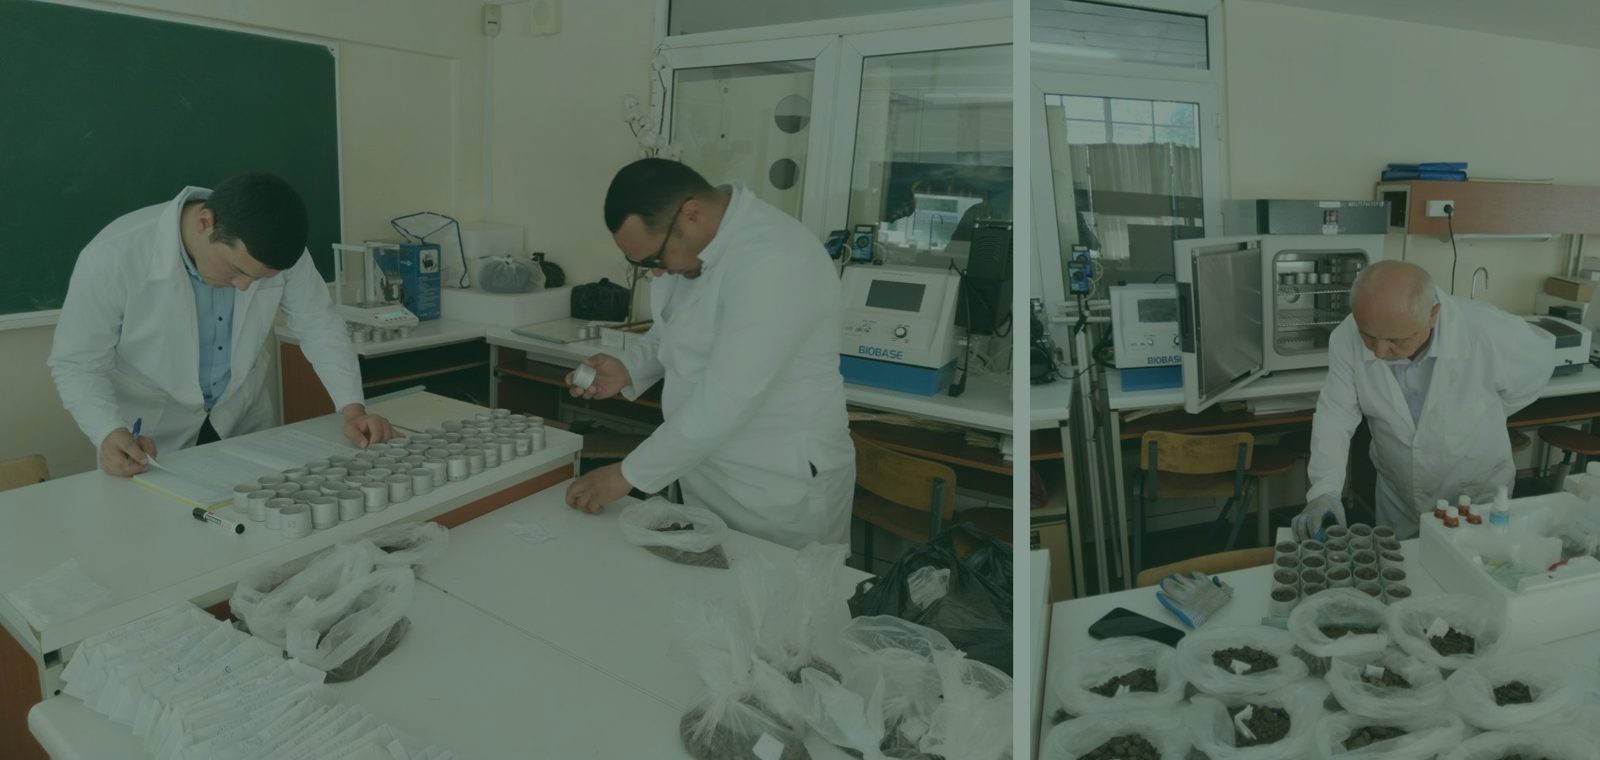
Laboratory preparation and agrochemical analysis
Sample reception, drying, sieving and analysis. Indicators: humus (Tyurin method), N–NO₃ and P₂O₅ (spectrophotometry), K₂O (flame photometry), oven 105 °C, mechanical composition.
QC: blank, control standard, ≥10% duplicates, calibration R² ≥ 0.995
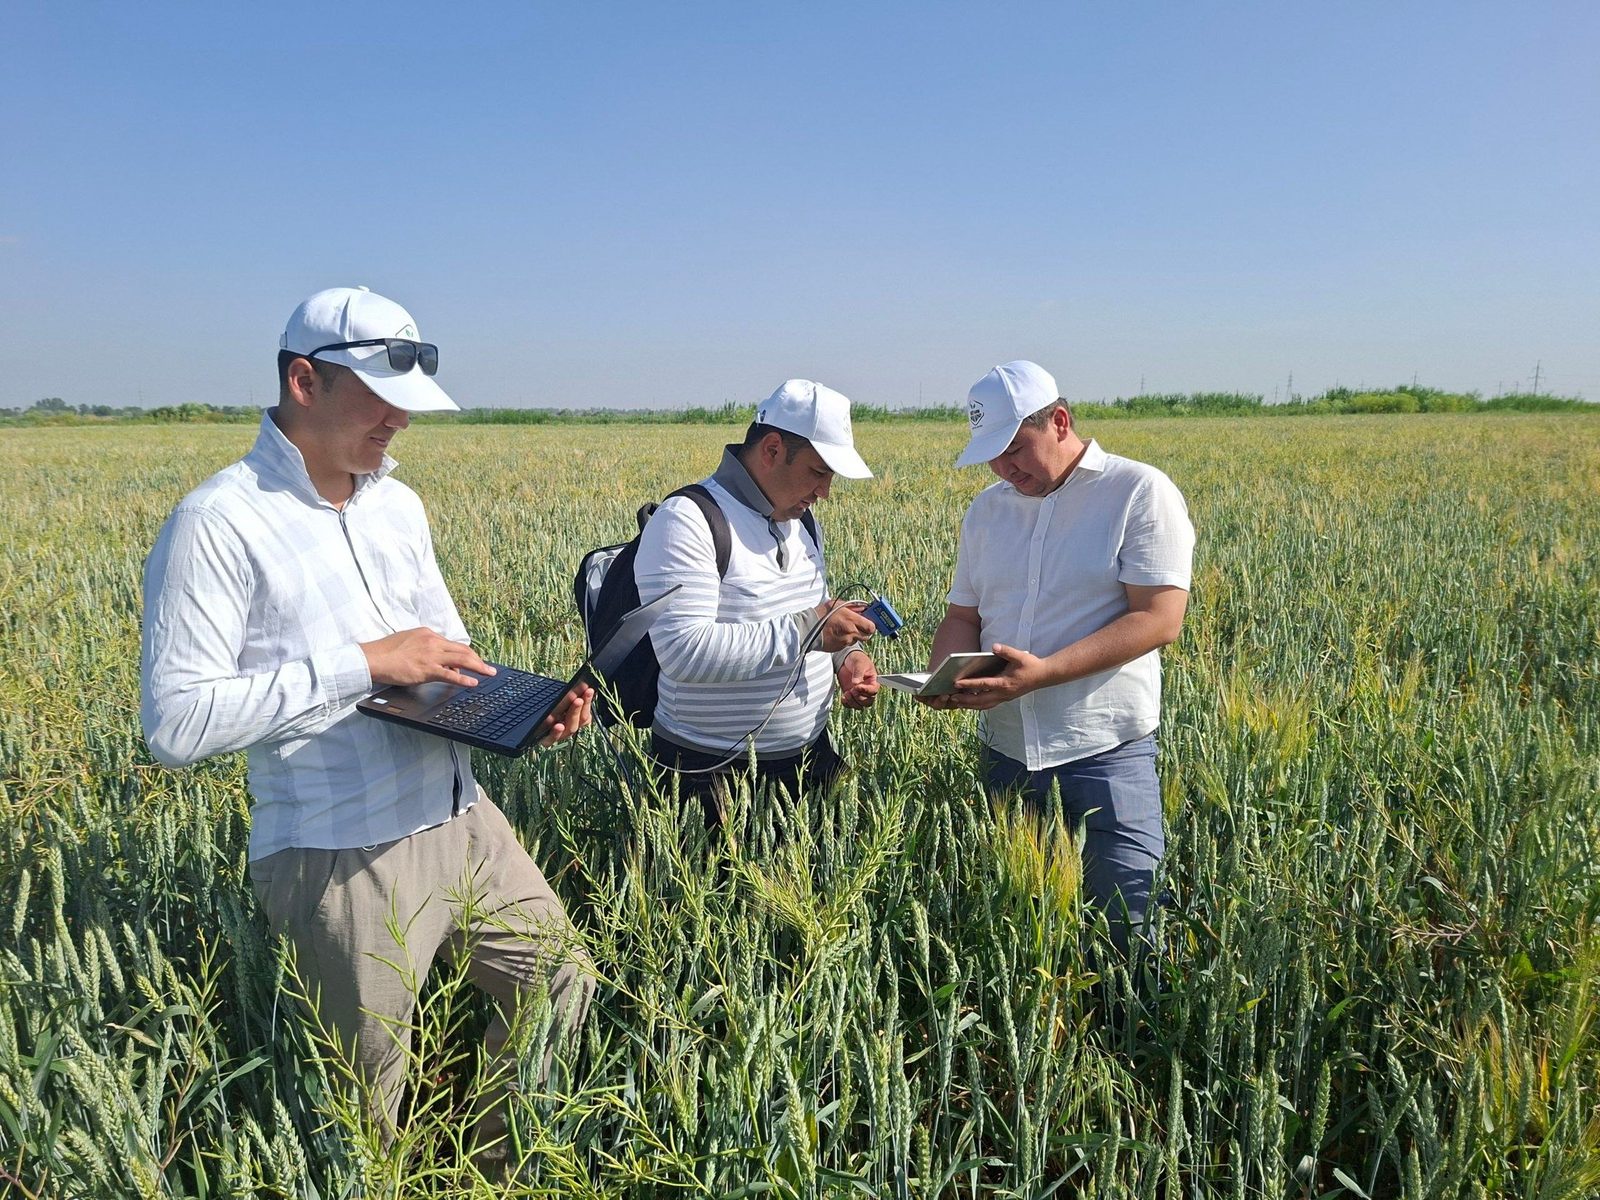
Field spectroradiometry
Spectroradiometer data were collected in the field with the OptoSky ATP9110, using a white reference panel and repeated measurements.
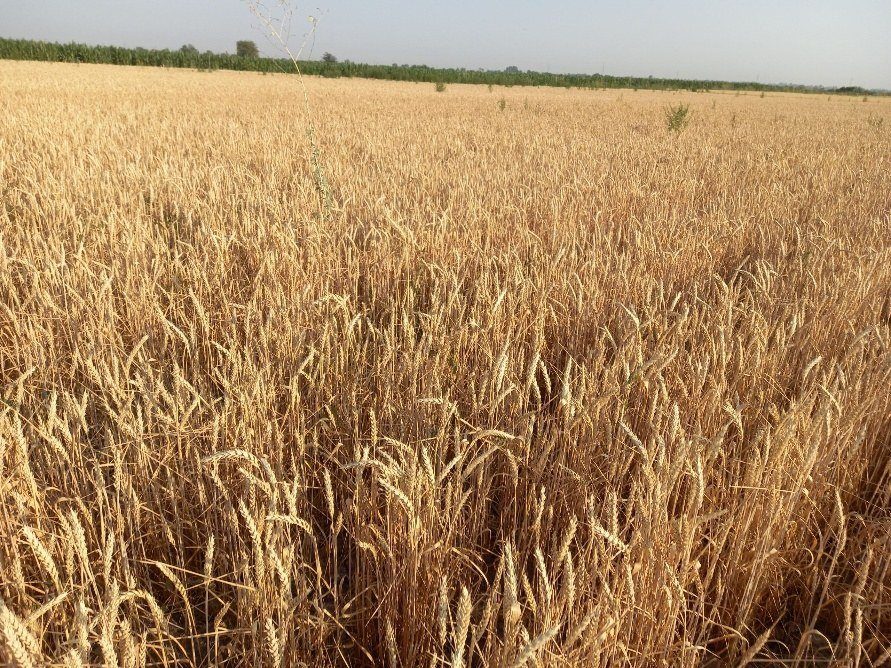
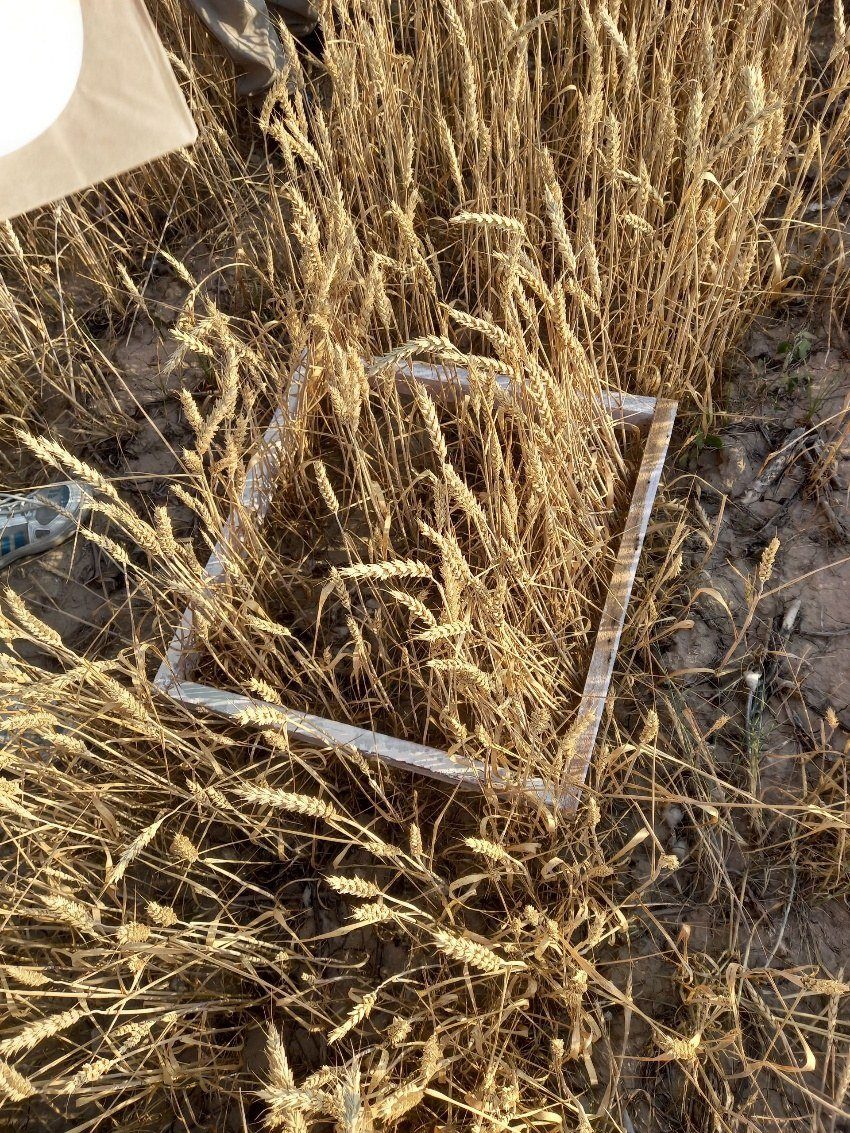
Ground truth for yield
Yield was harvested within 1 × 1 m quadrats: ear count, grain count and grain mass were measured at each point and linked via GNSS coordinates to the Sentinel‑2 pixel and the yield model.
All data types were collected on the same fields at georeferenced points. This made it possible to link the soil–plant–satellite–yield chain and independently validate the model.
Soil, moisture, vegetation, spectra and yield
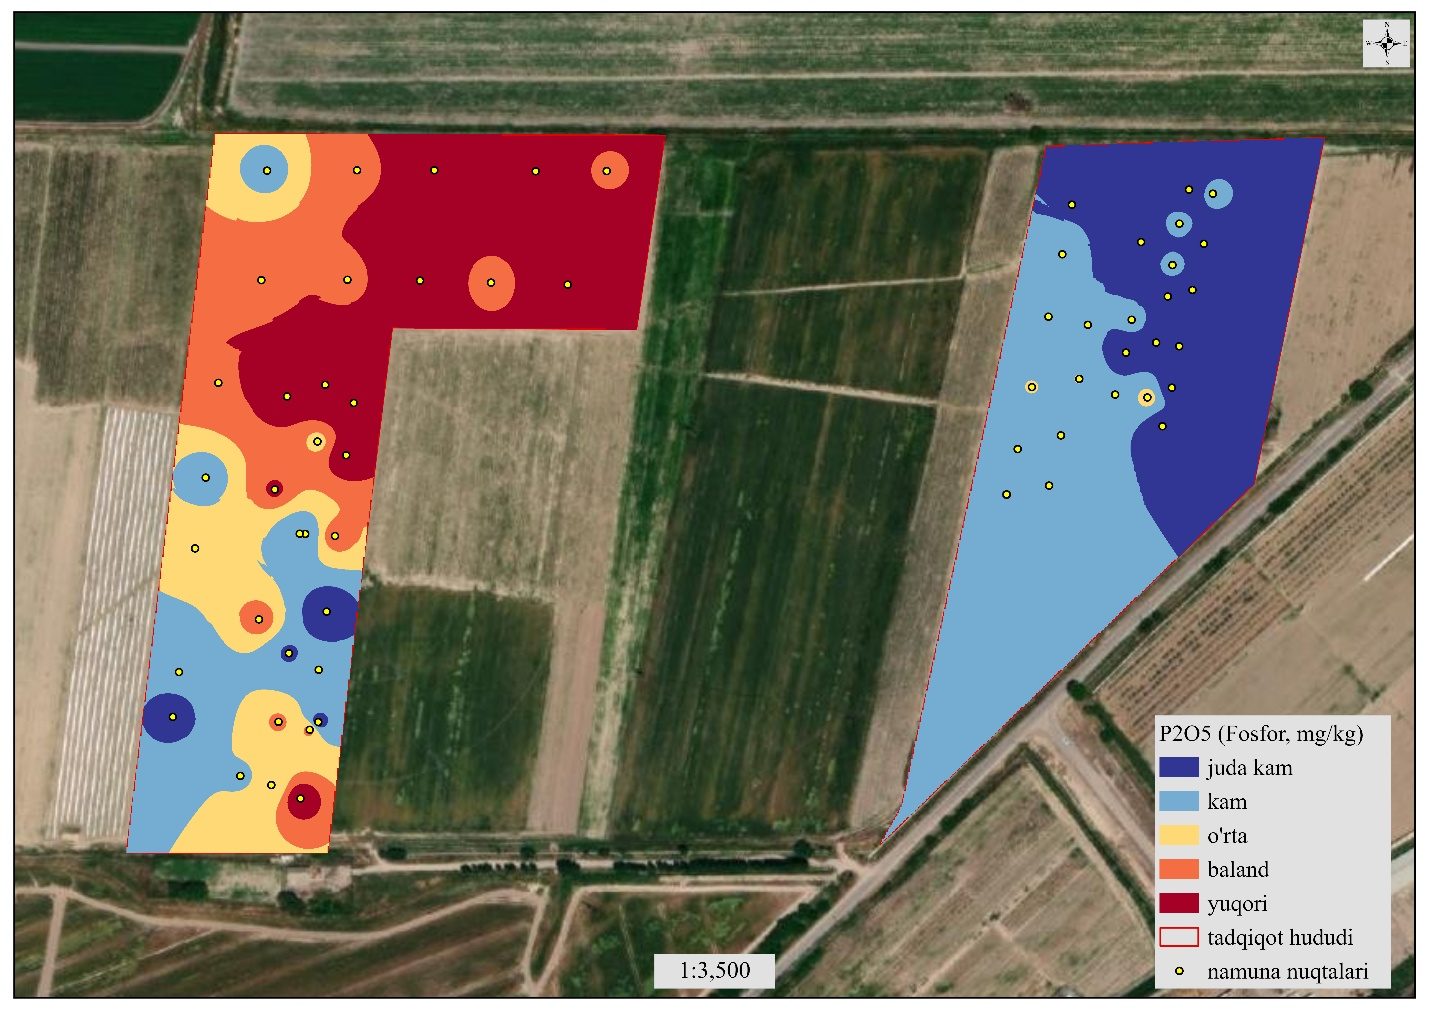
Available phosphorus is the main limiting factor
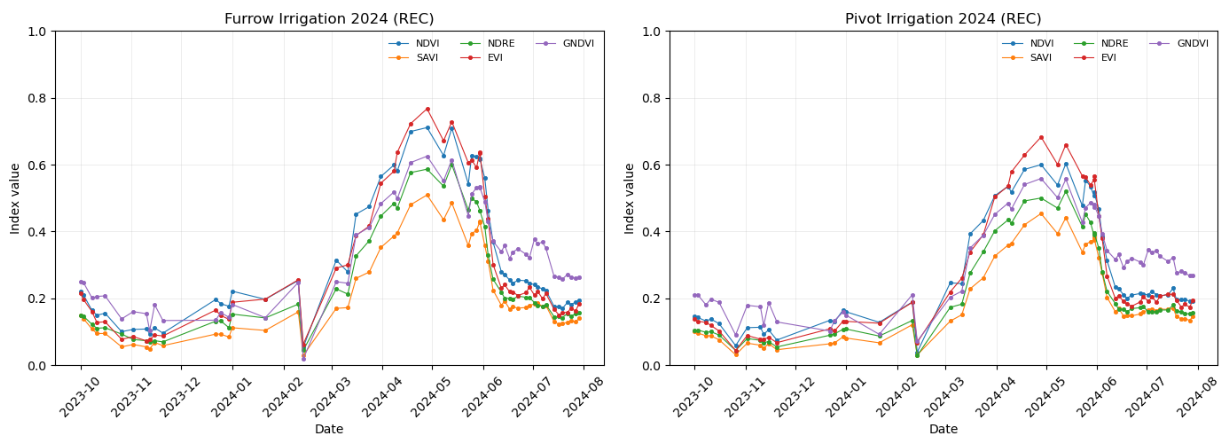
Dynamics of NDVI, EVI, NDRE, GNDVI, SAVI, NDMI
Hyperspectral field library for cereals
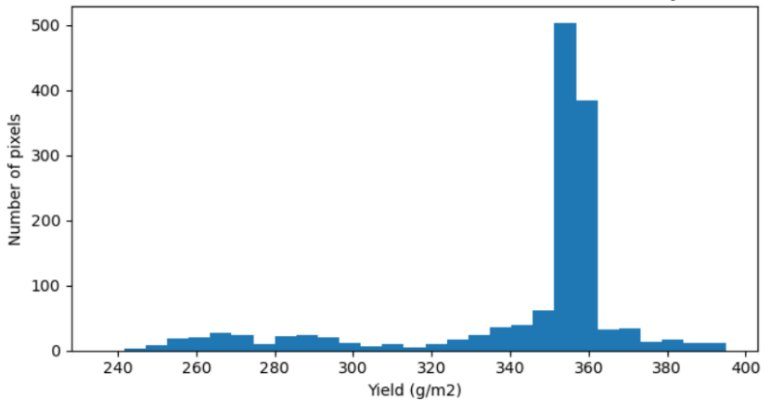
ExtraTrees: R² 0.71; RMSE 10.8 c/ha
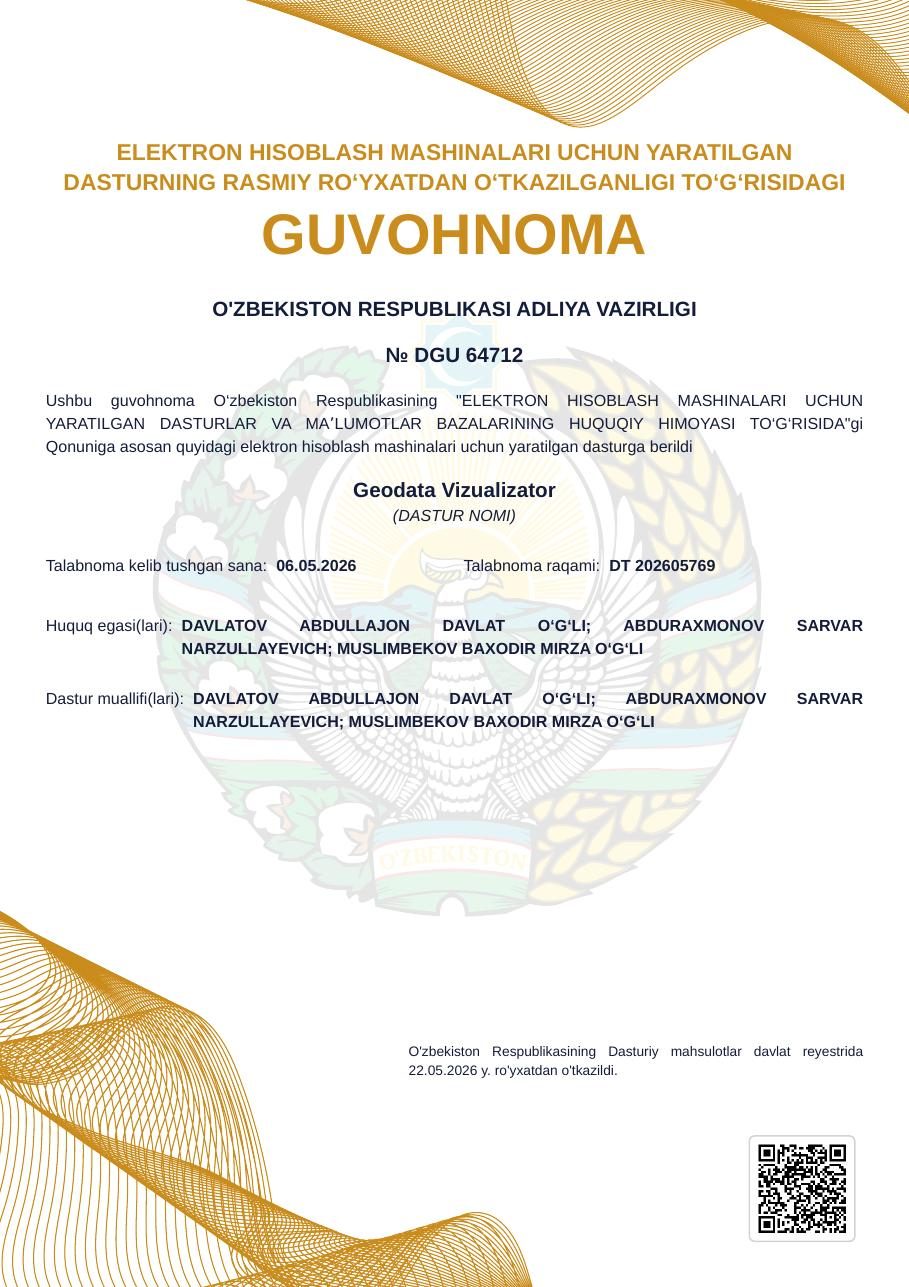
2 intellectual property objects
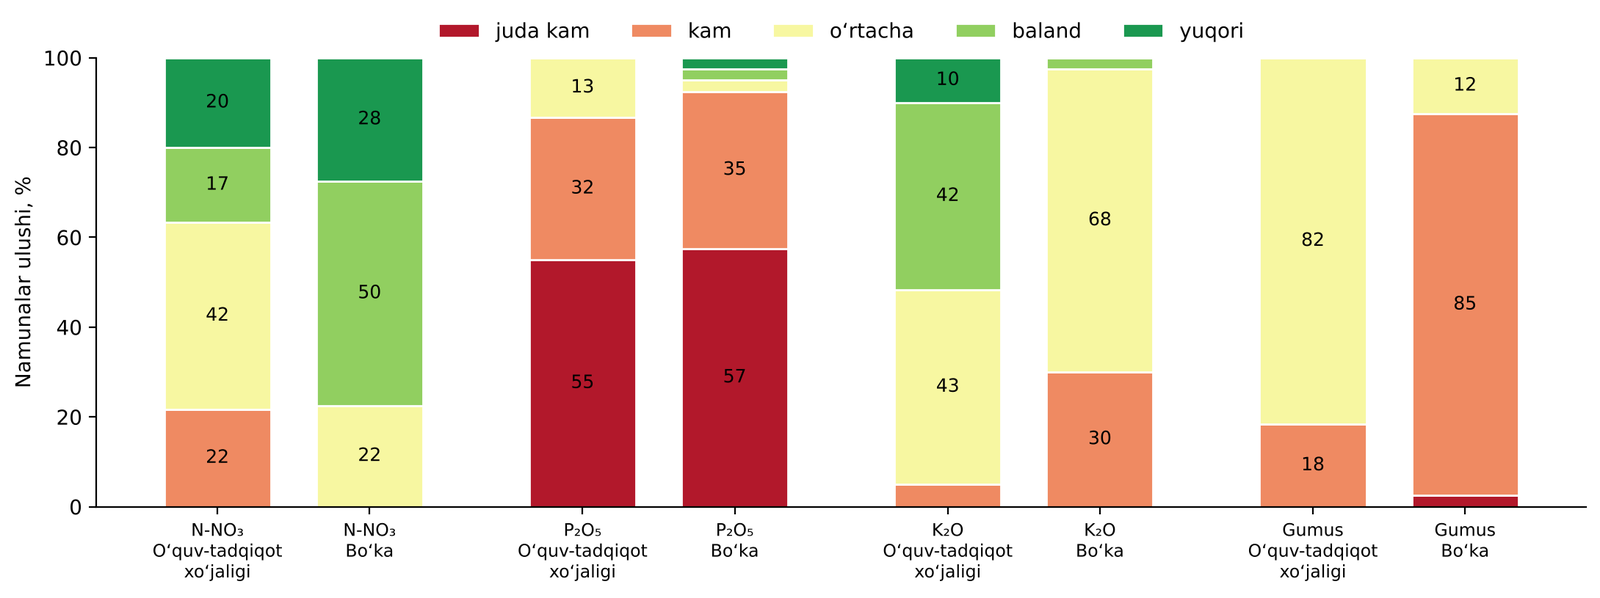
Soil nutrient supply classes, 2025
Available phosphorus fell into the “very low” or “low” class at many points and was identified as the main limiting factor. Potassium was generally high to very high, humus mostly low to medium, and nitrogen varied with irrigation and agronomic background.
2025 — spatial distribution of nitrogen and phosphorus
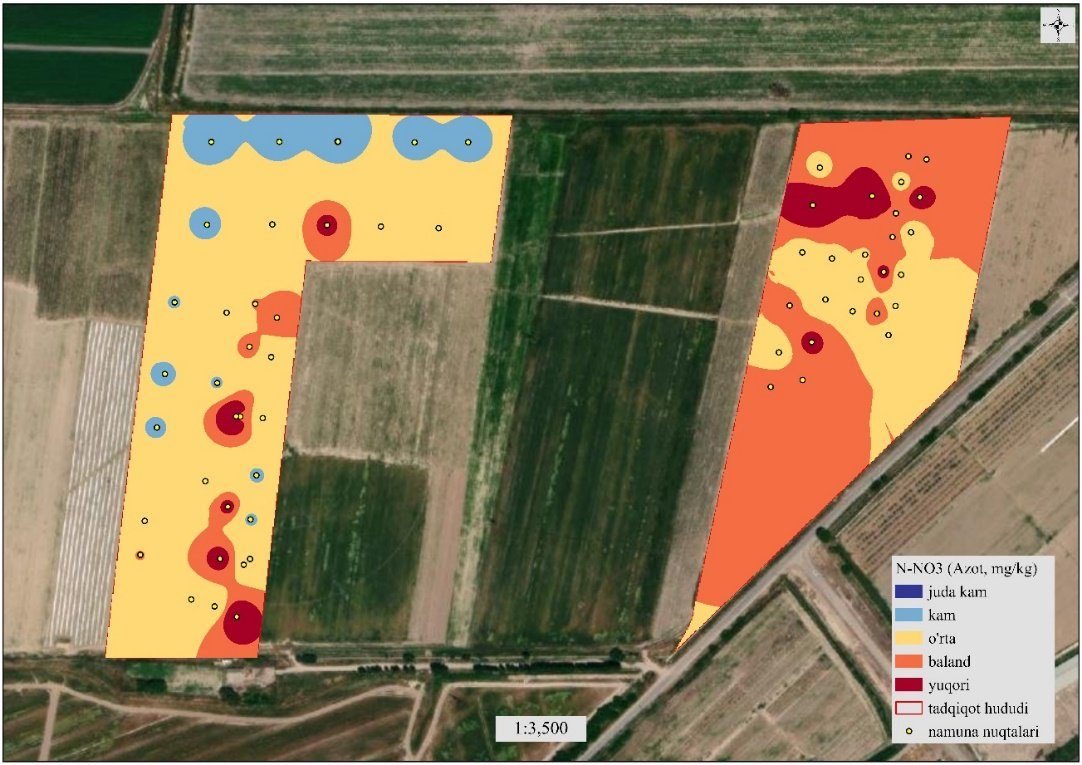
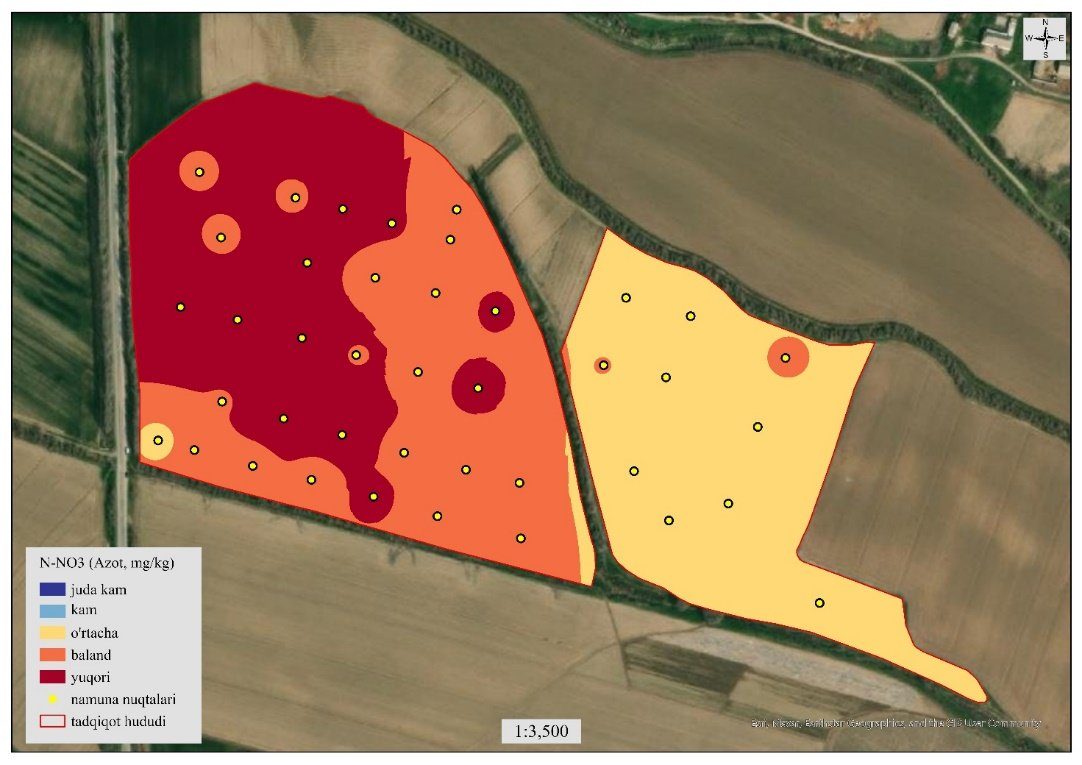
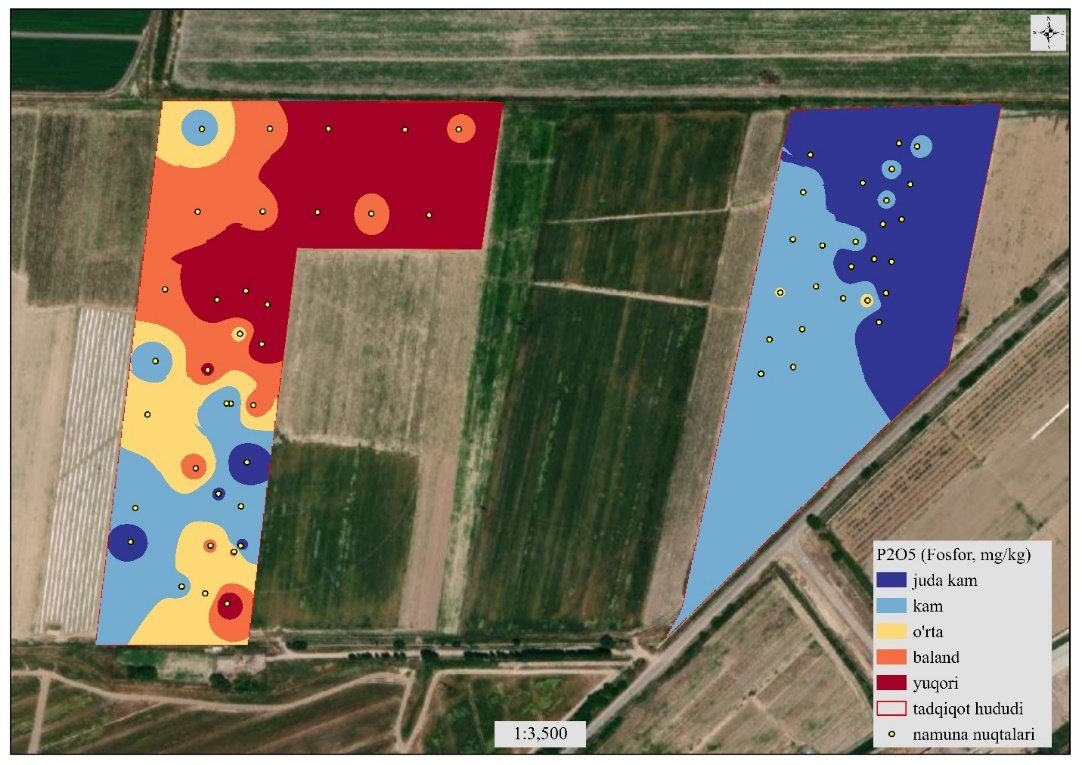
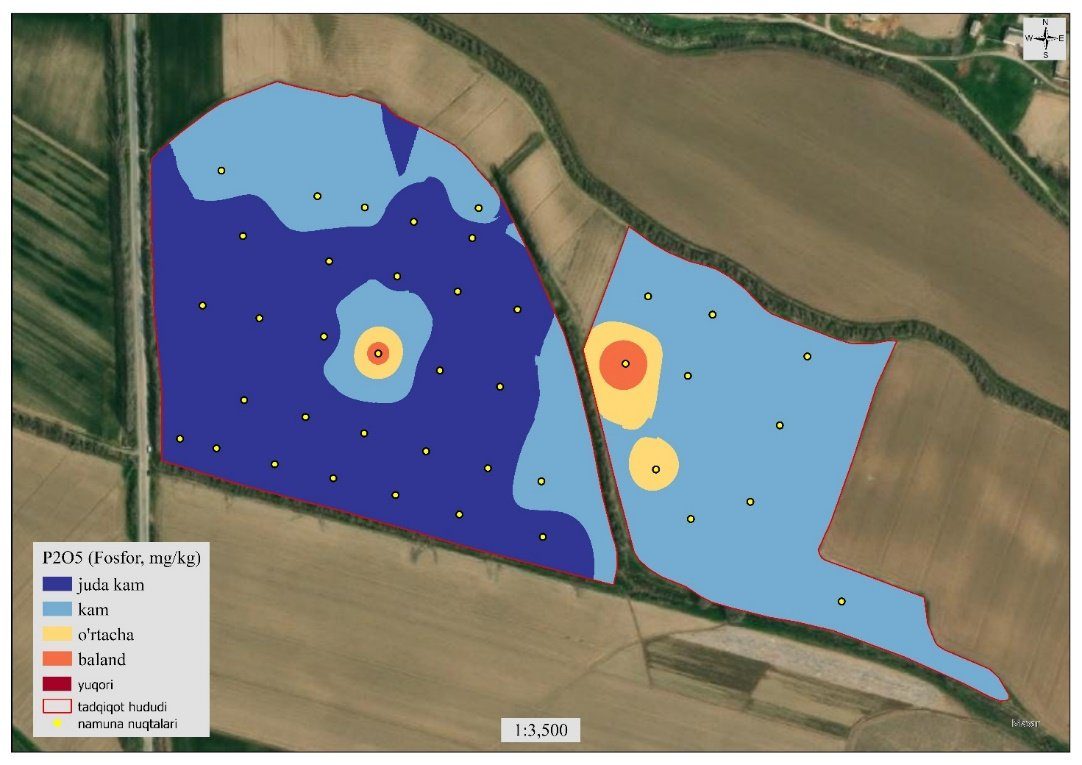
Spatial variability of nitrogen depends on irrigation and fertilization history; phosphorus deficiency in both areas calls for zonal, differentiated fertilization.
2025 — potassium and humus
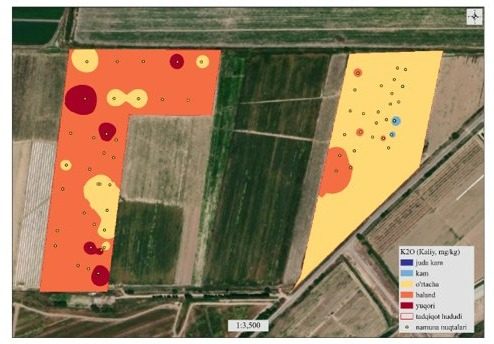
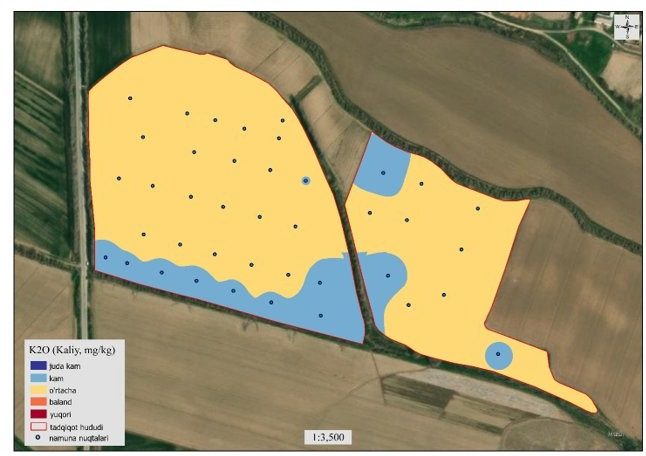
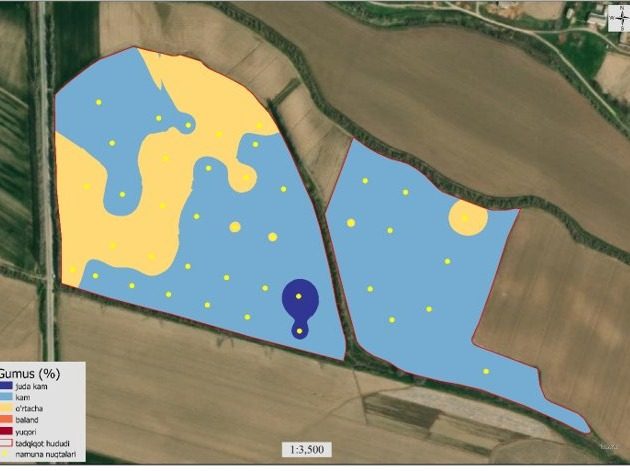
Potassium reserves are sufficient in many zones; to preserve humus, organic matter, residue return and minimum tillage are recommended.
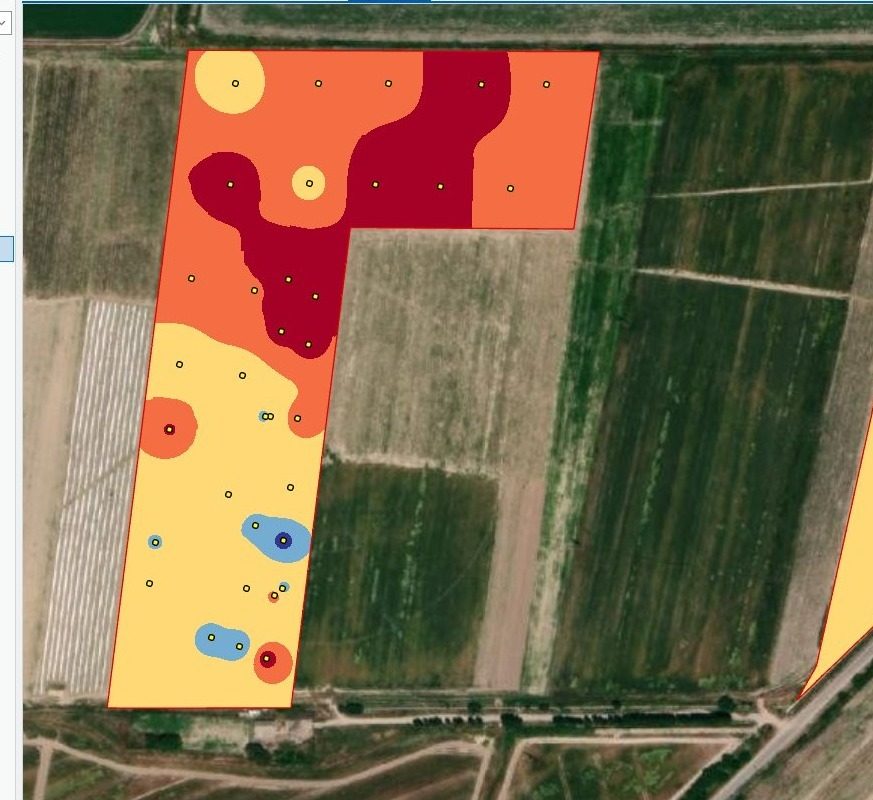
2026 — Middle Chirchiq soil maps (nitrogen, phosphorus, potassium, humus)
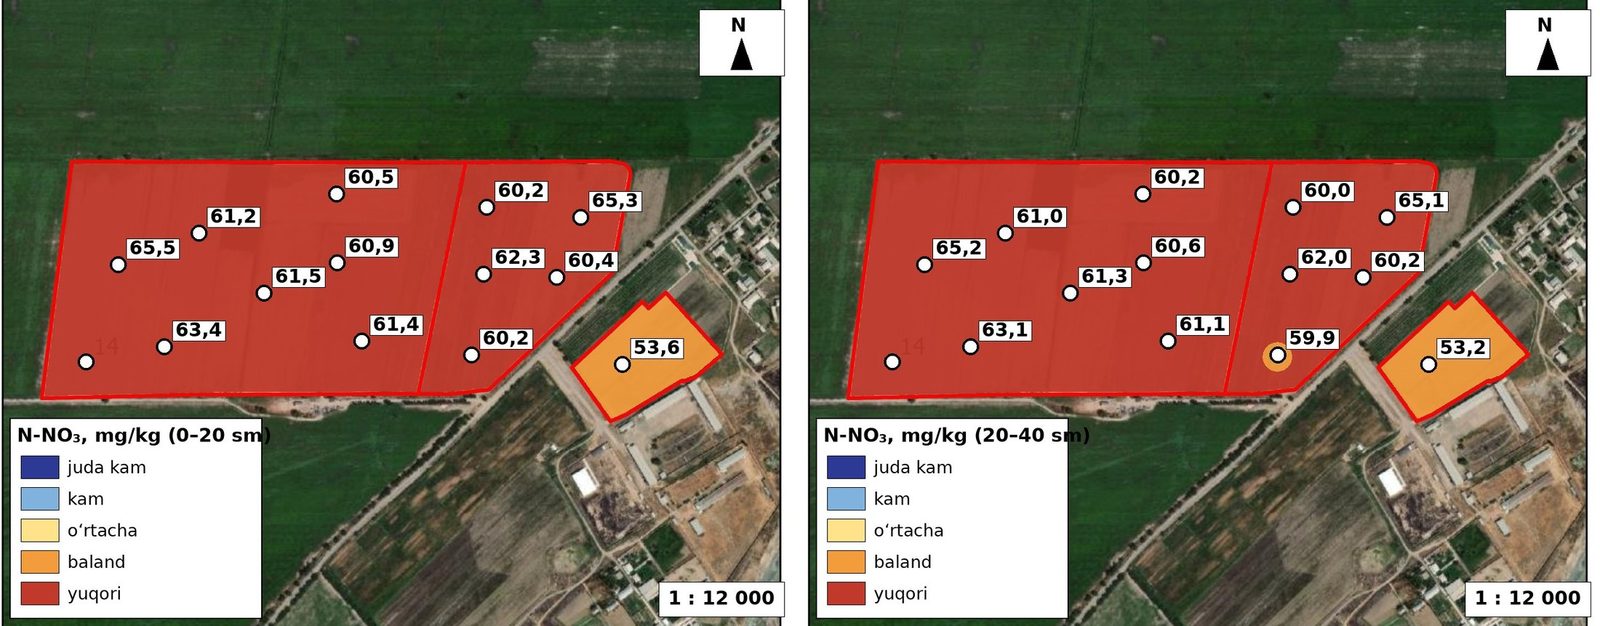
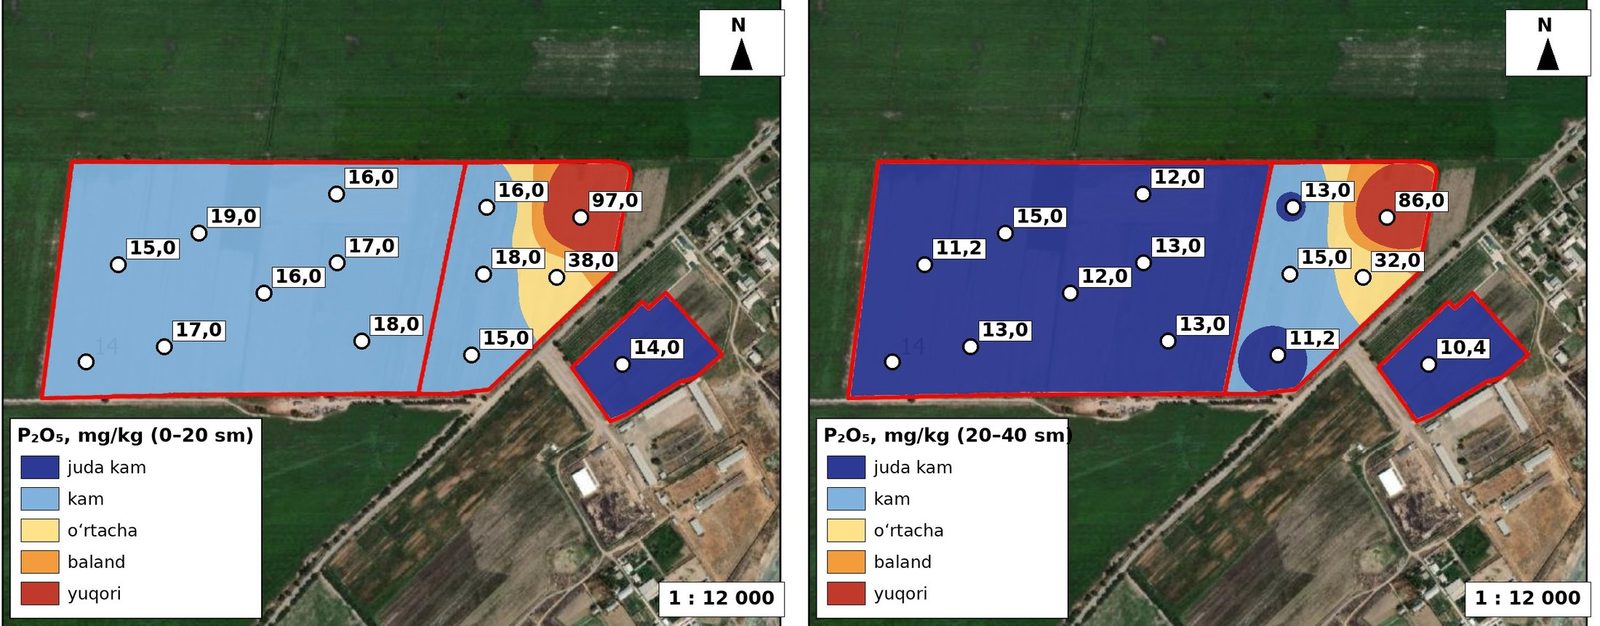
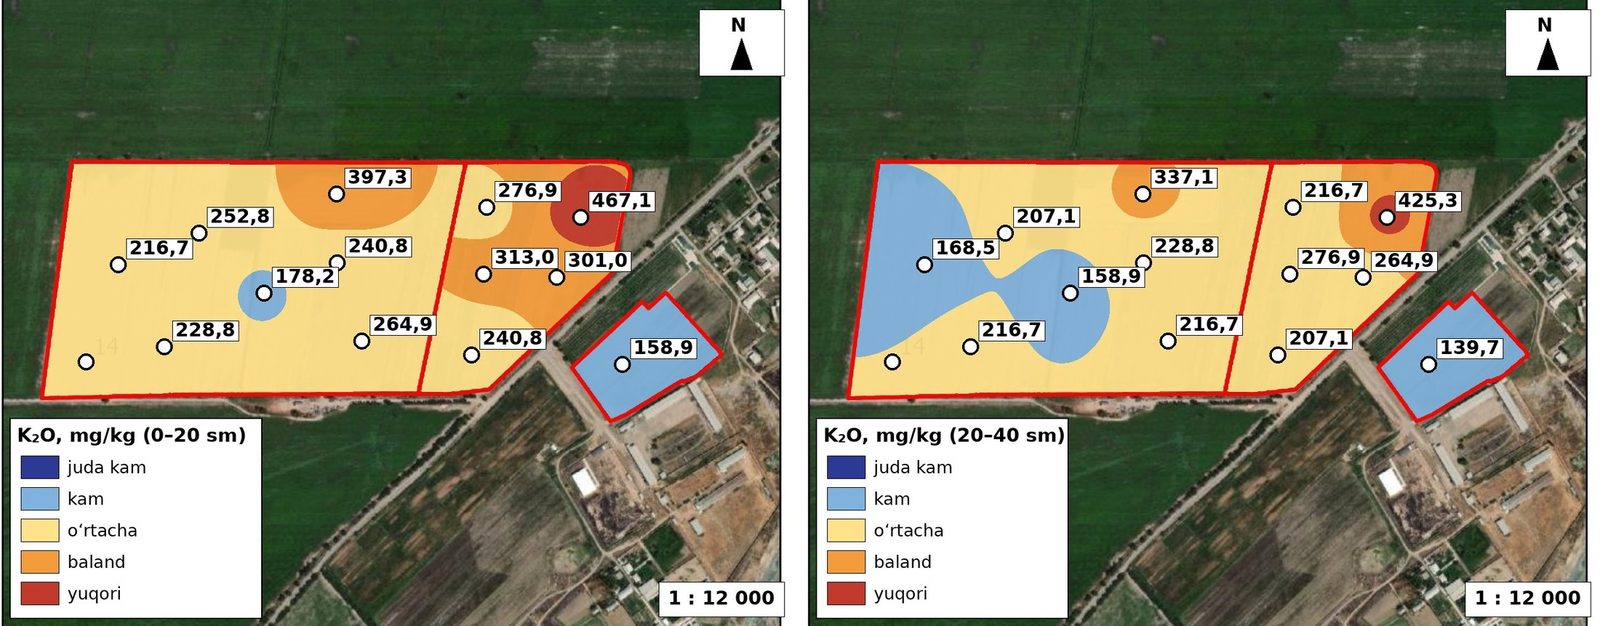
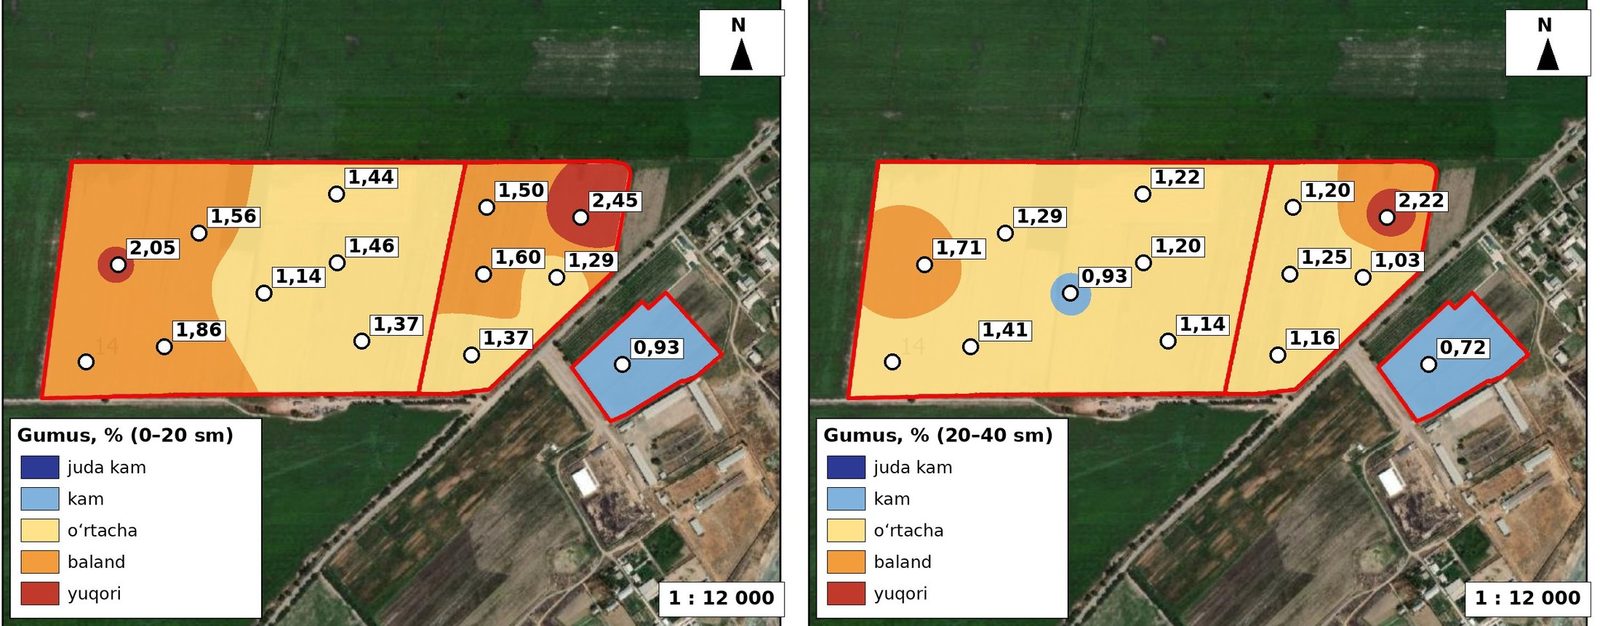
2026 — Boka area soil maps (nitrogen, phosphorus, potassium, humus)
Five neighbouring farms were covered together with the main field; results enabled management zones to be delineated at a wider scale.
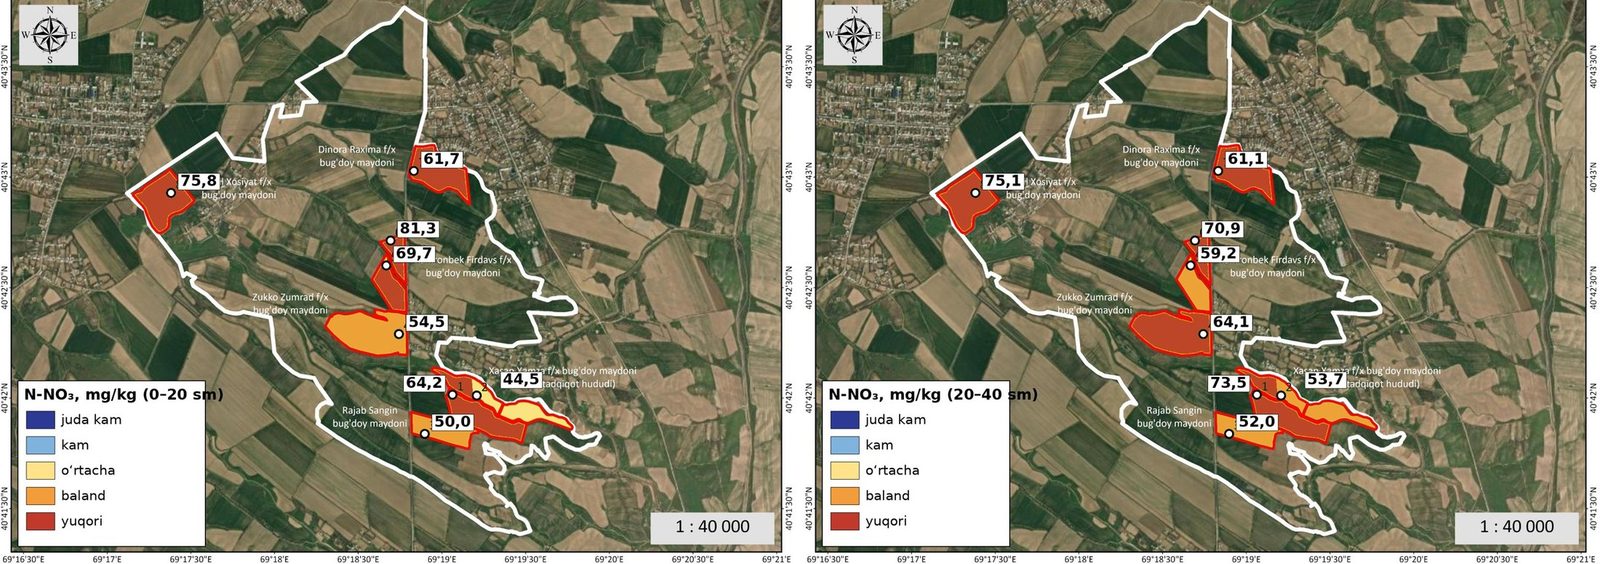
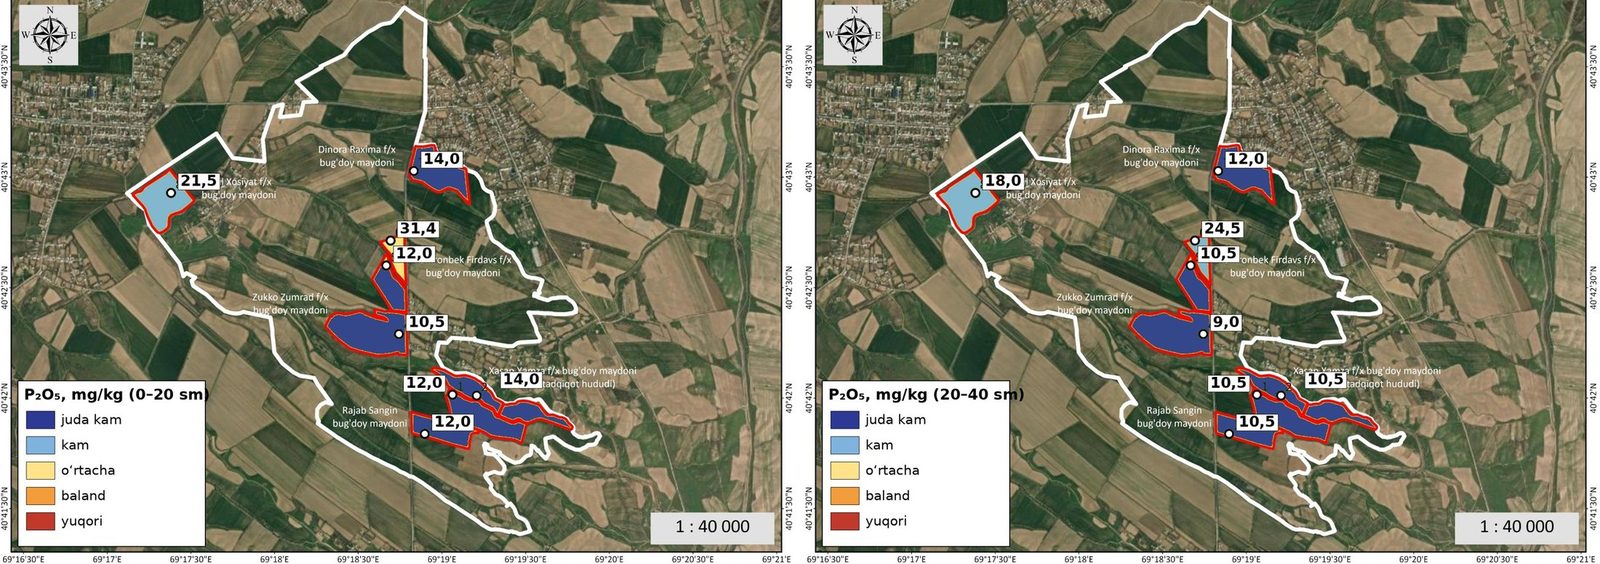
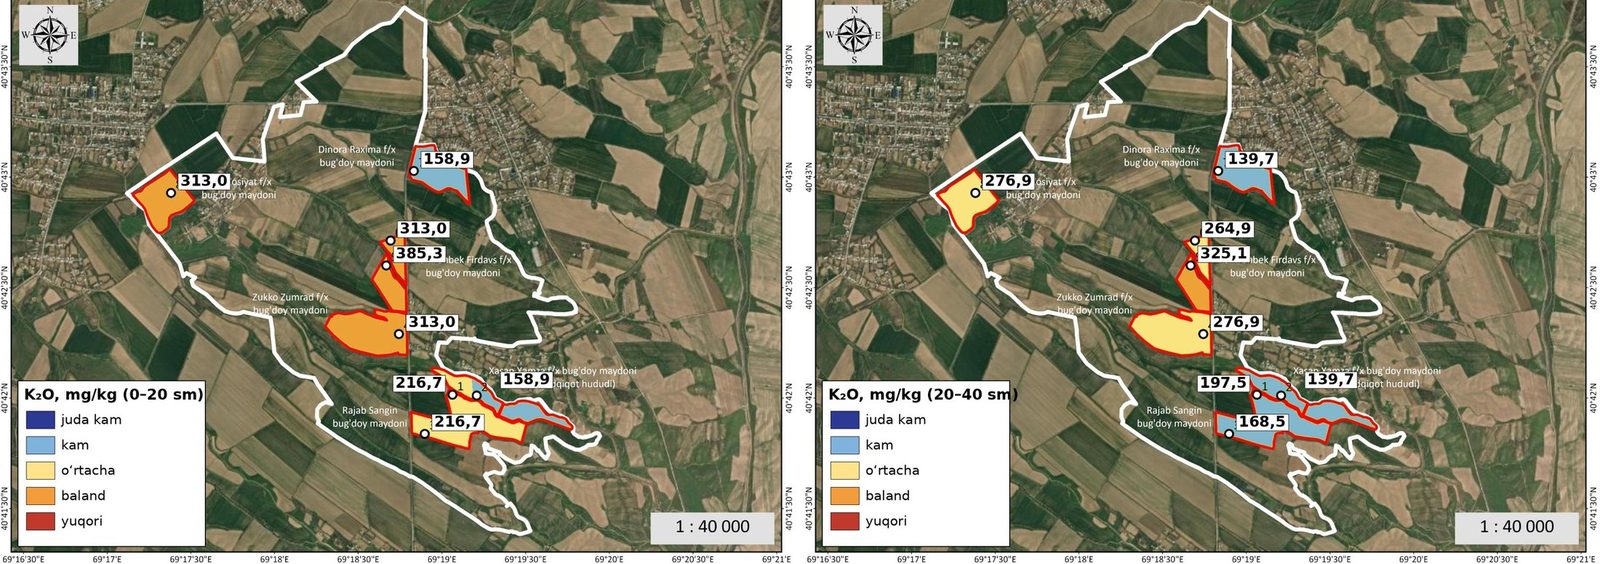
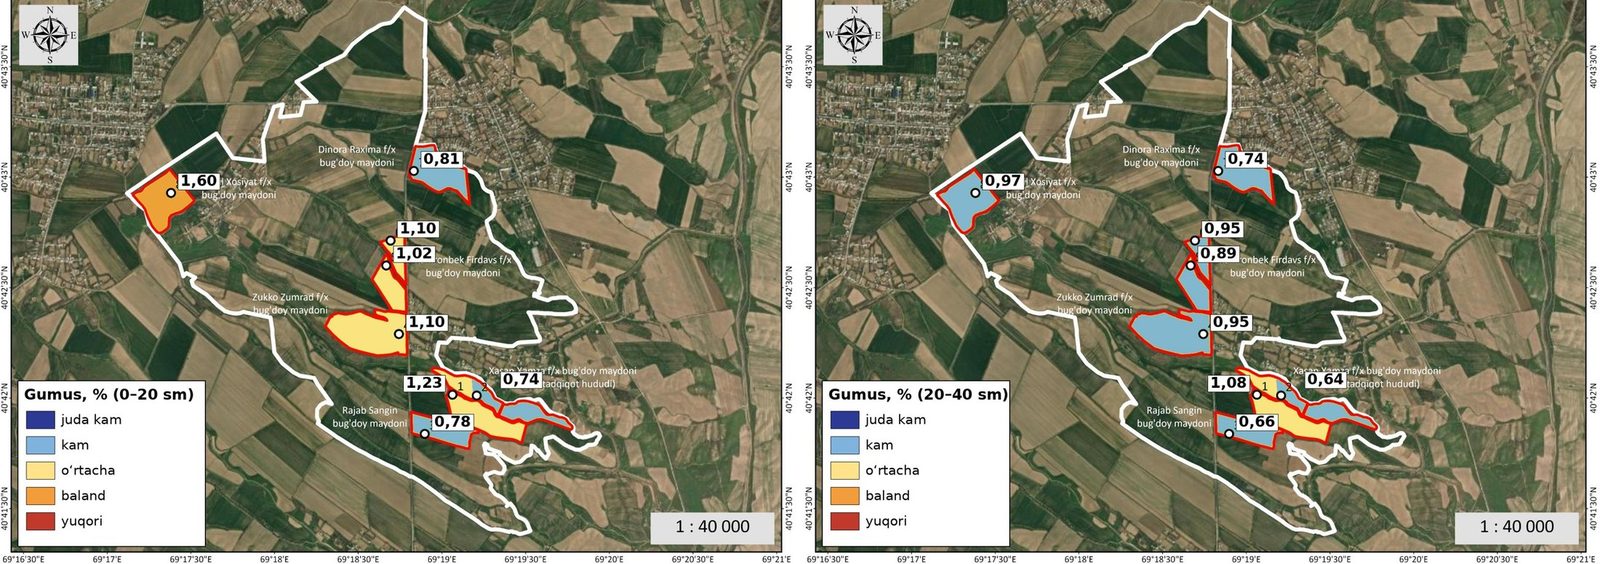
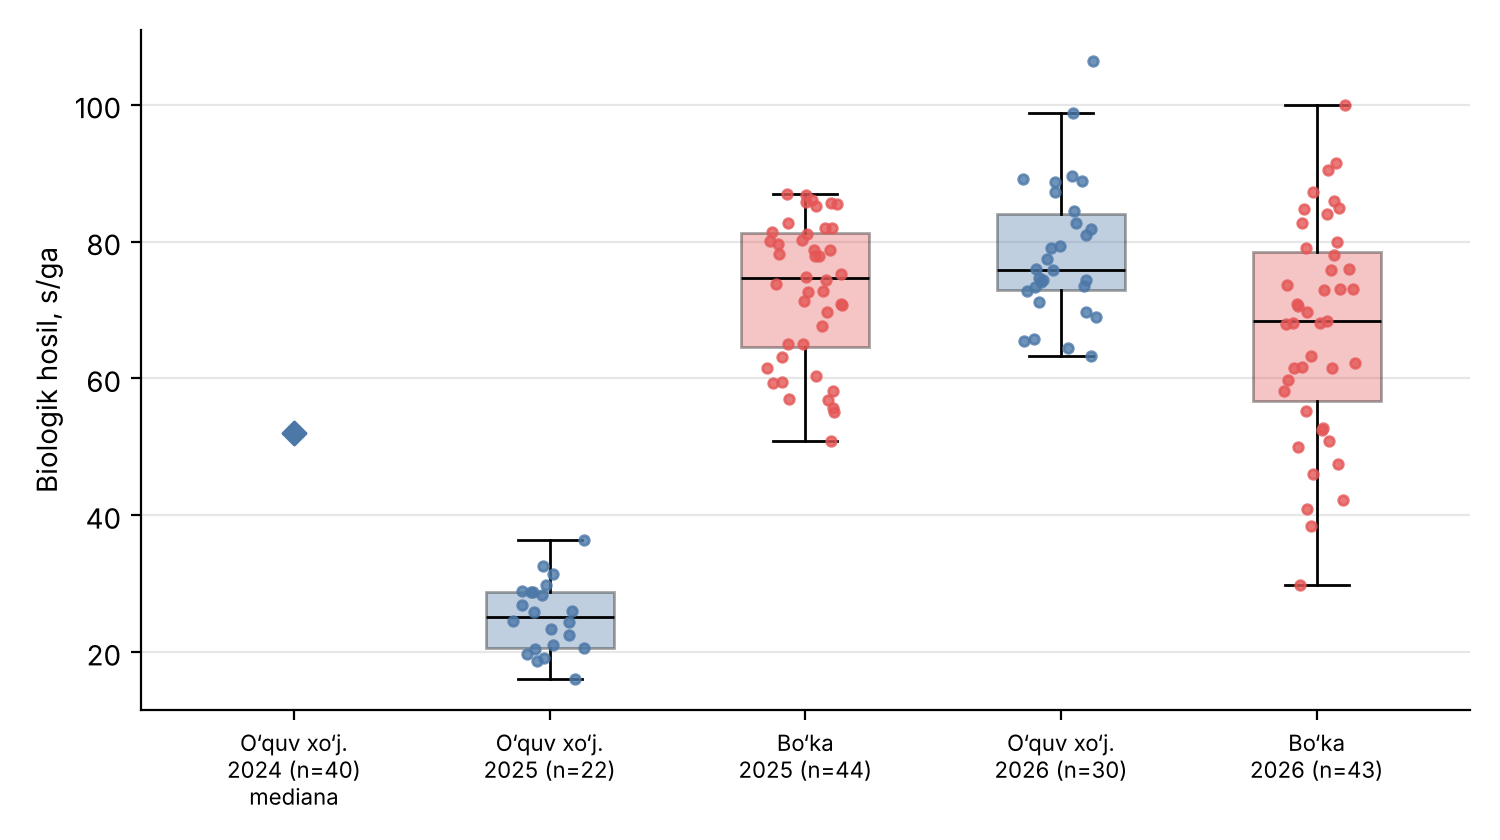
Soil properties, yield and three-year comparison
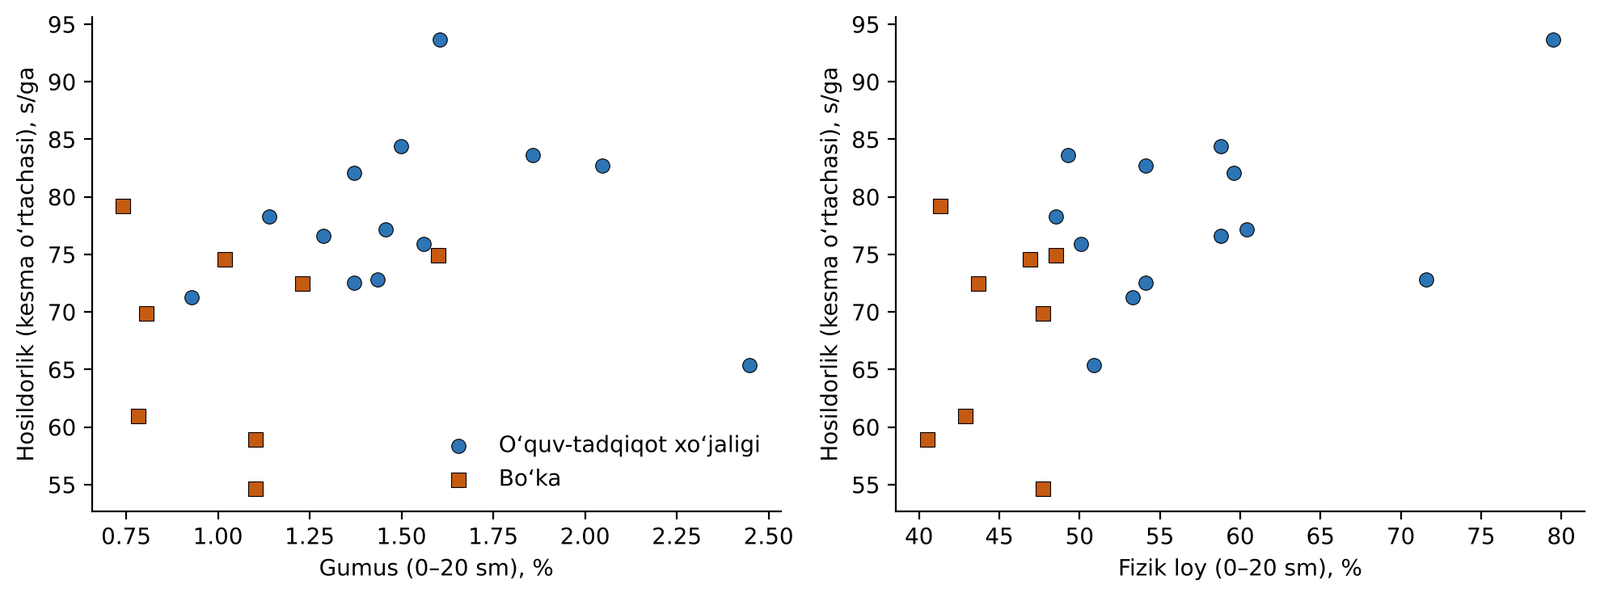
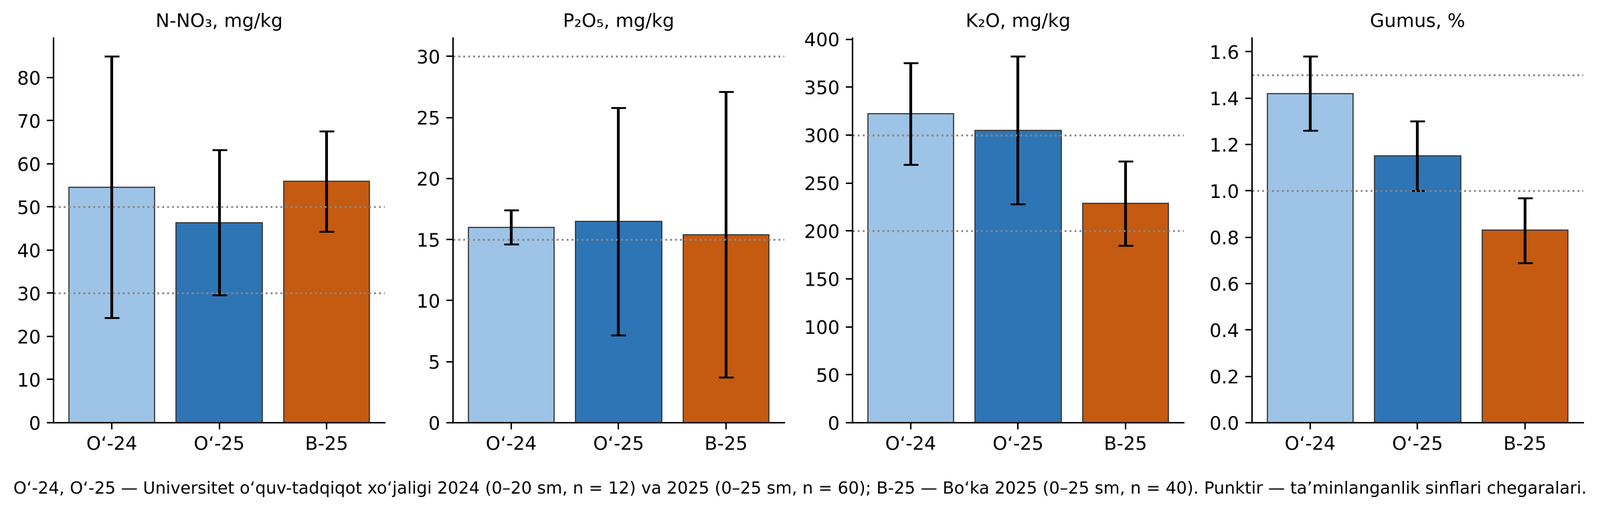
Results show that a universal recommendation based on a single parameter is insufficient: fertilizer, moisture, texture, irrigation and phenology must be interpreted together.
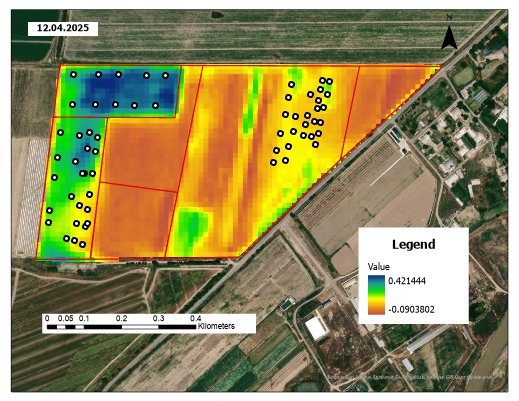
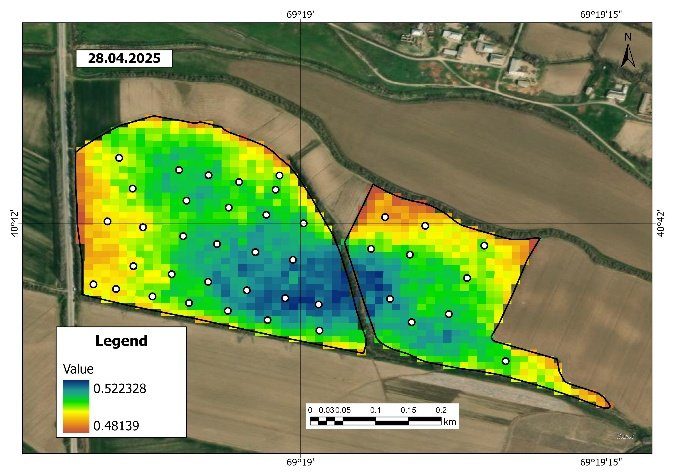
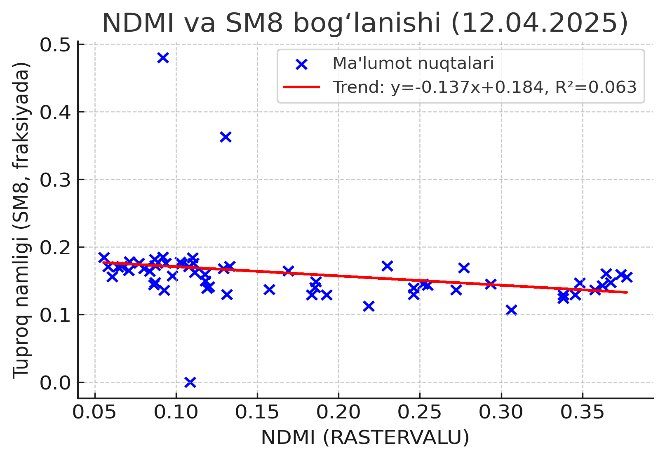
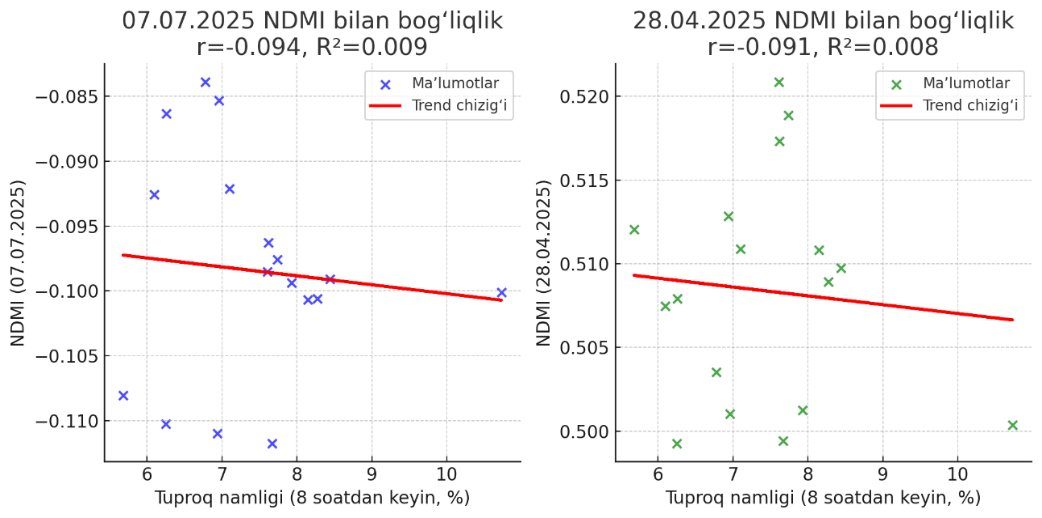
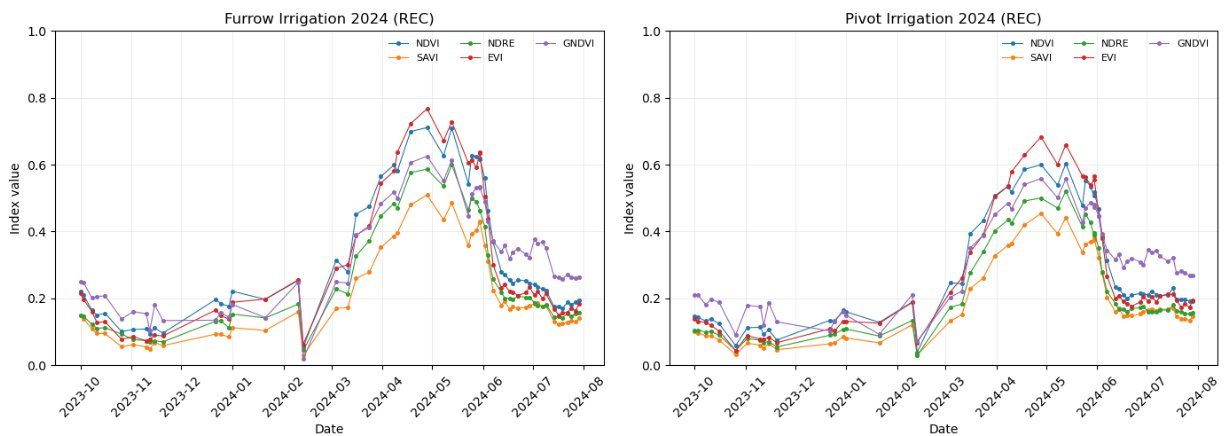
Time series of NDVI, EVI, GNDVI, NDRE, SAVI and NDMI supported spatio-temporal monitoring of growth, heading, grain filling and ripening.
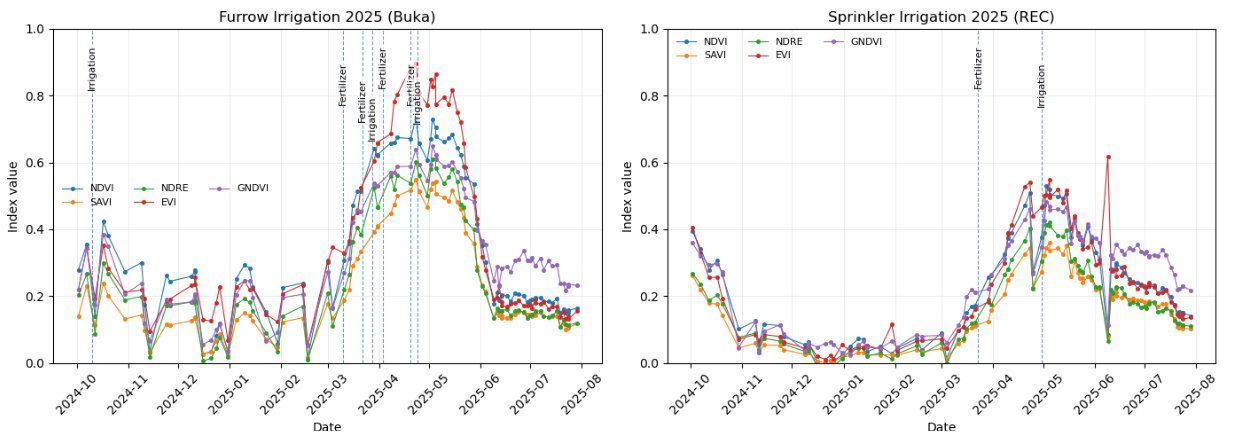
Spatial variation of NDVI
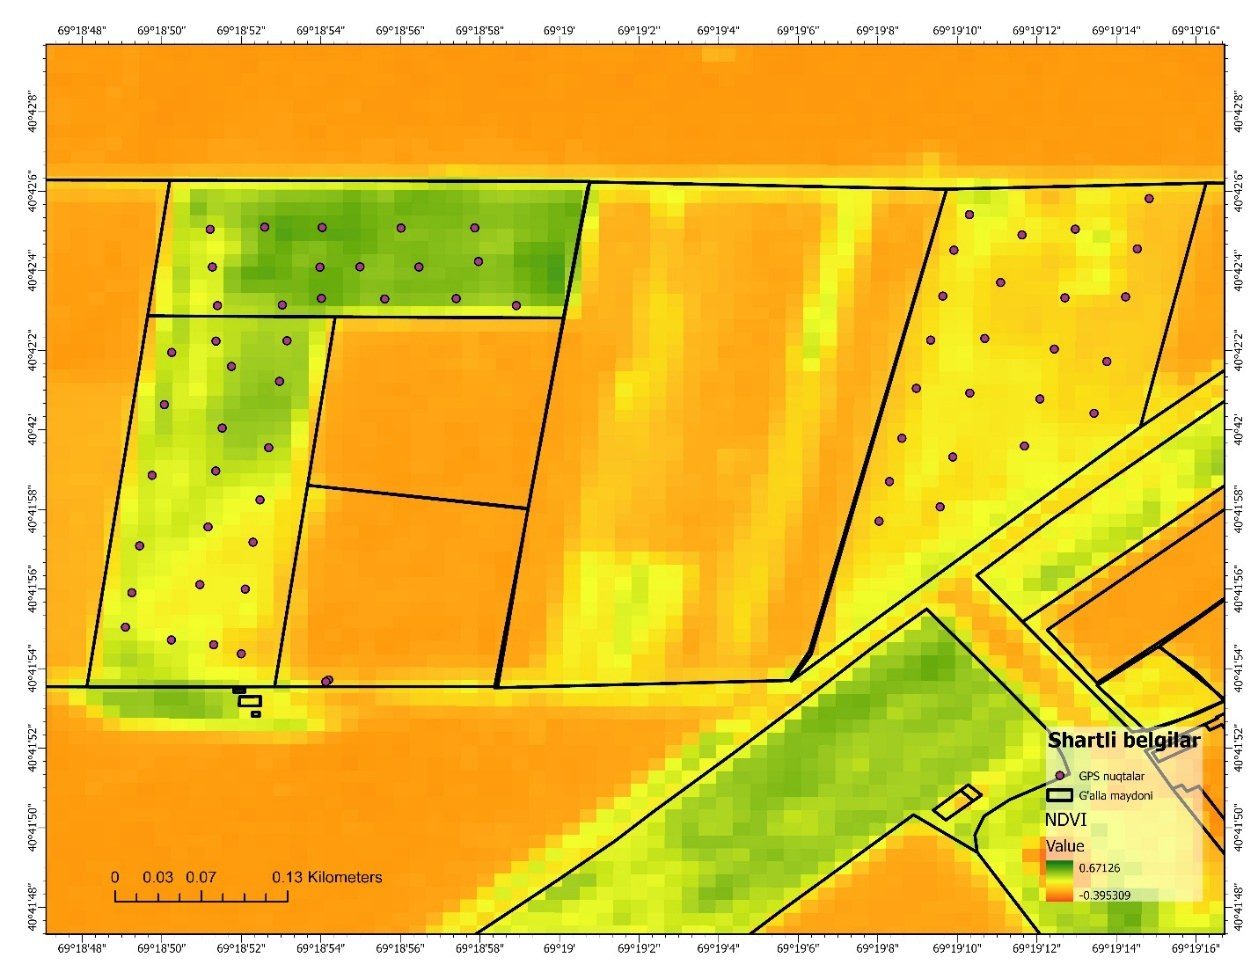
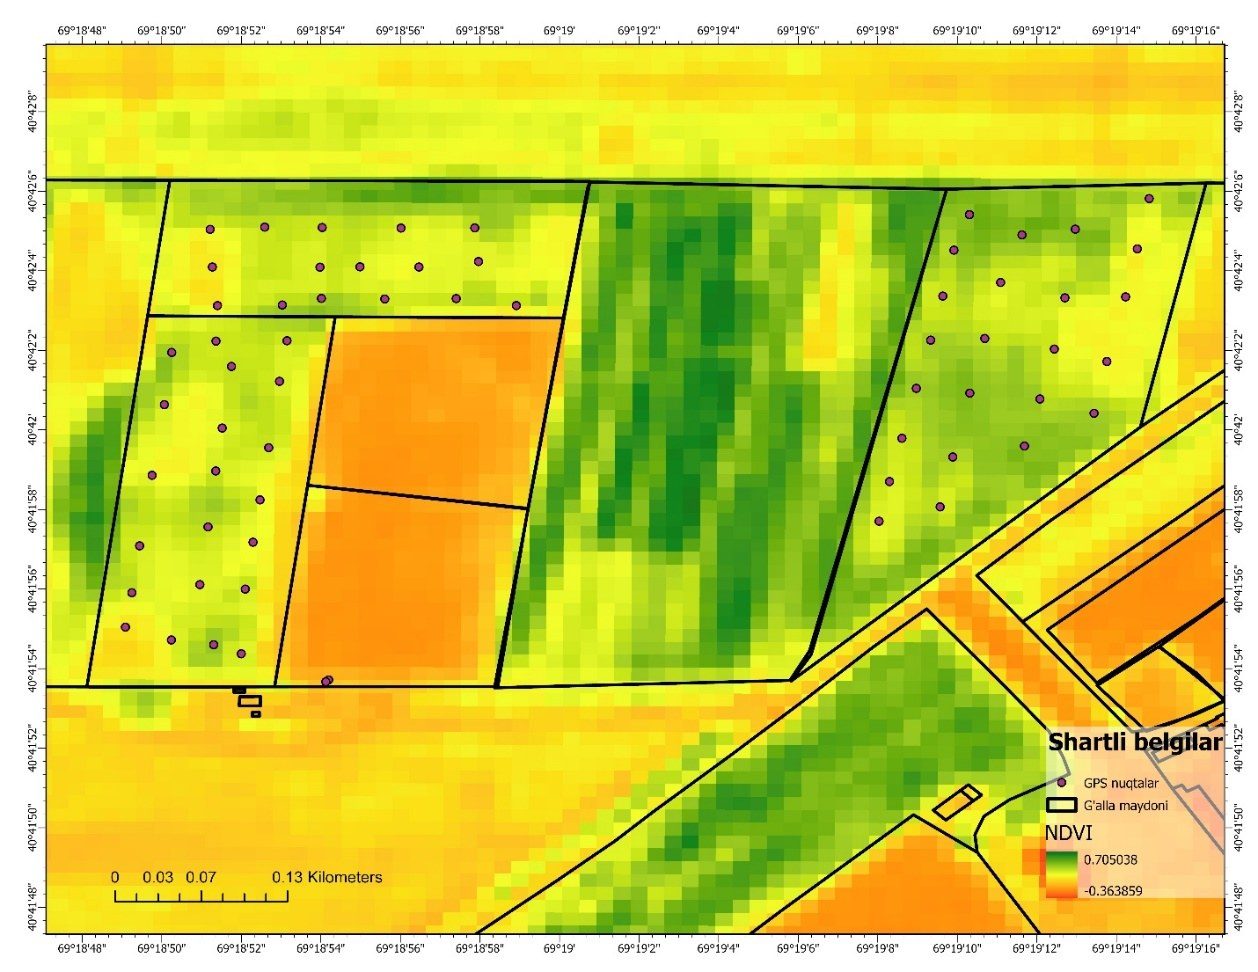
NDVI differences over time and space reflected variations in irrigation technology, cultivar, agronomic background and canopy density.
Field vs Sentinel‑2 NDVI: scale mismatch
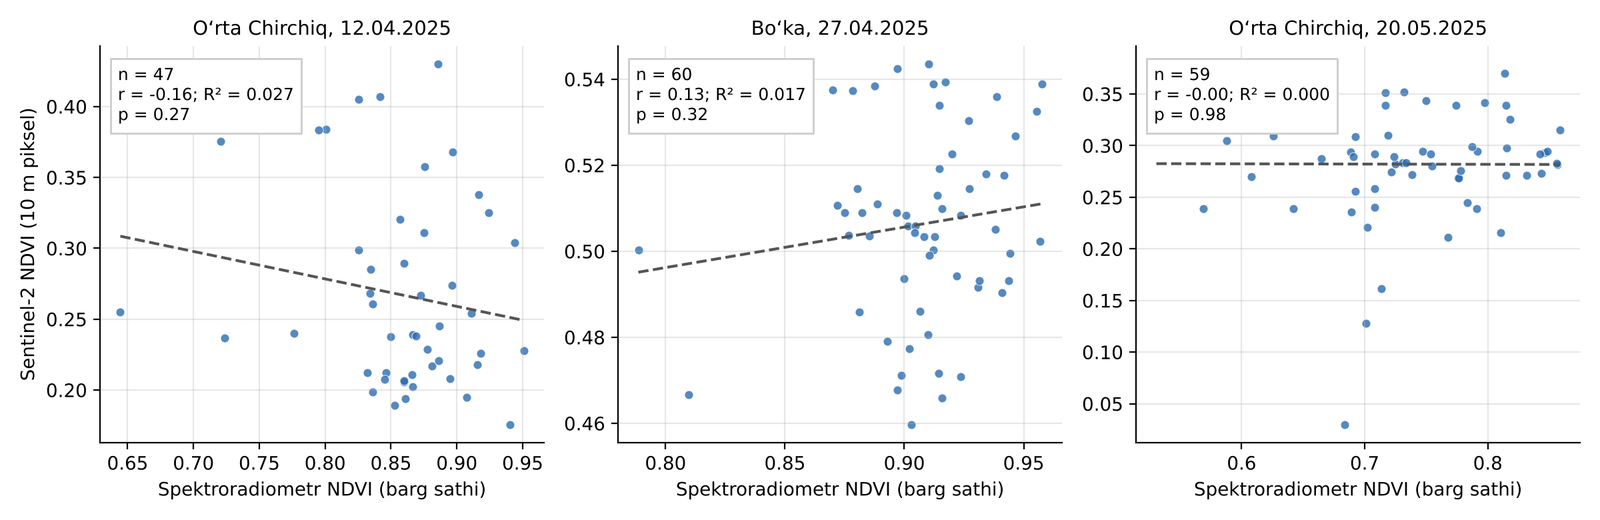
- Leaf level: centimetre scale
- Sentinel‑2: 100 m² mixed pixel
- Soil background, shadow, ditches and weeds
- Date and GNSS errors as additional factors
Field spectra and satellite values cannot be equated directly: band equivalents and a scale-appropriate protocol are required.
2026 cereal spectral library: 23 narrow-band indices — vegetation, chlorophyll, red-edge, pigments, photosynthetic efficiency and water status.
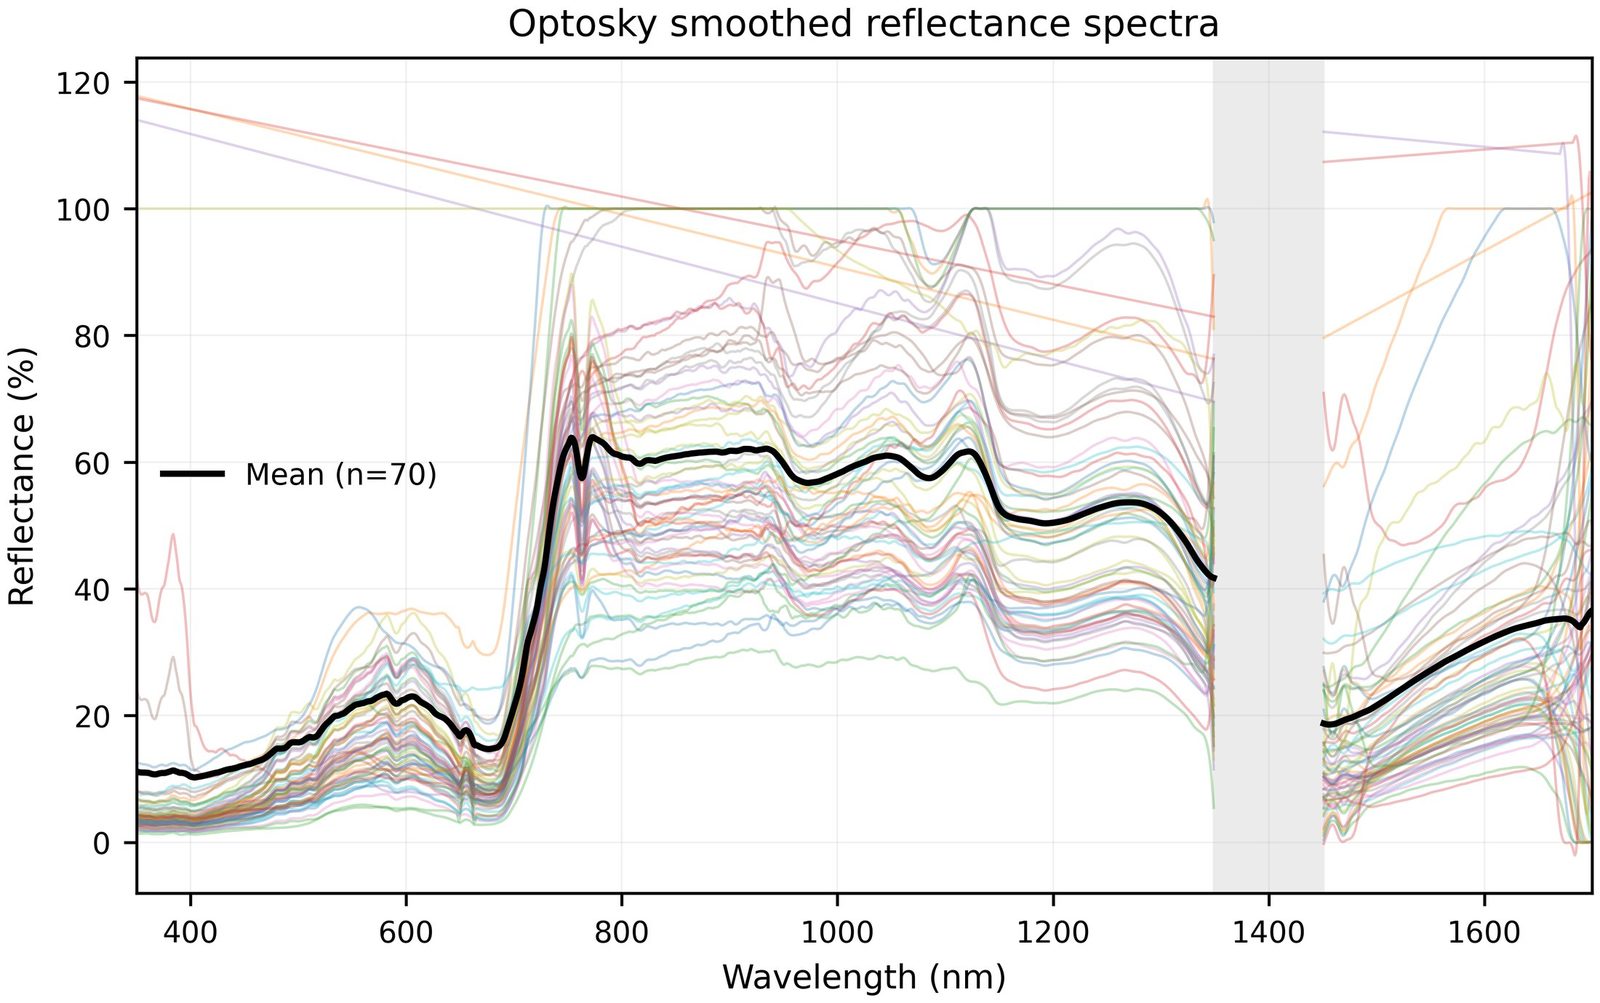
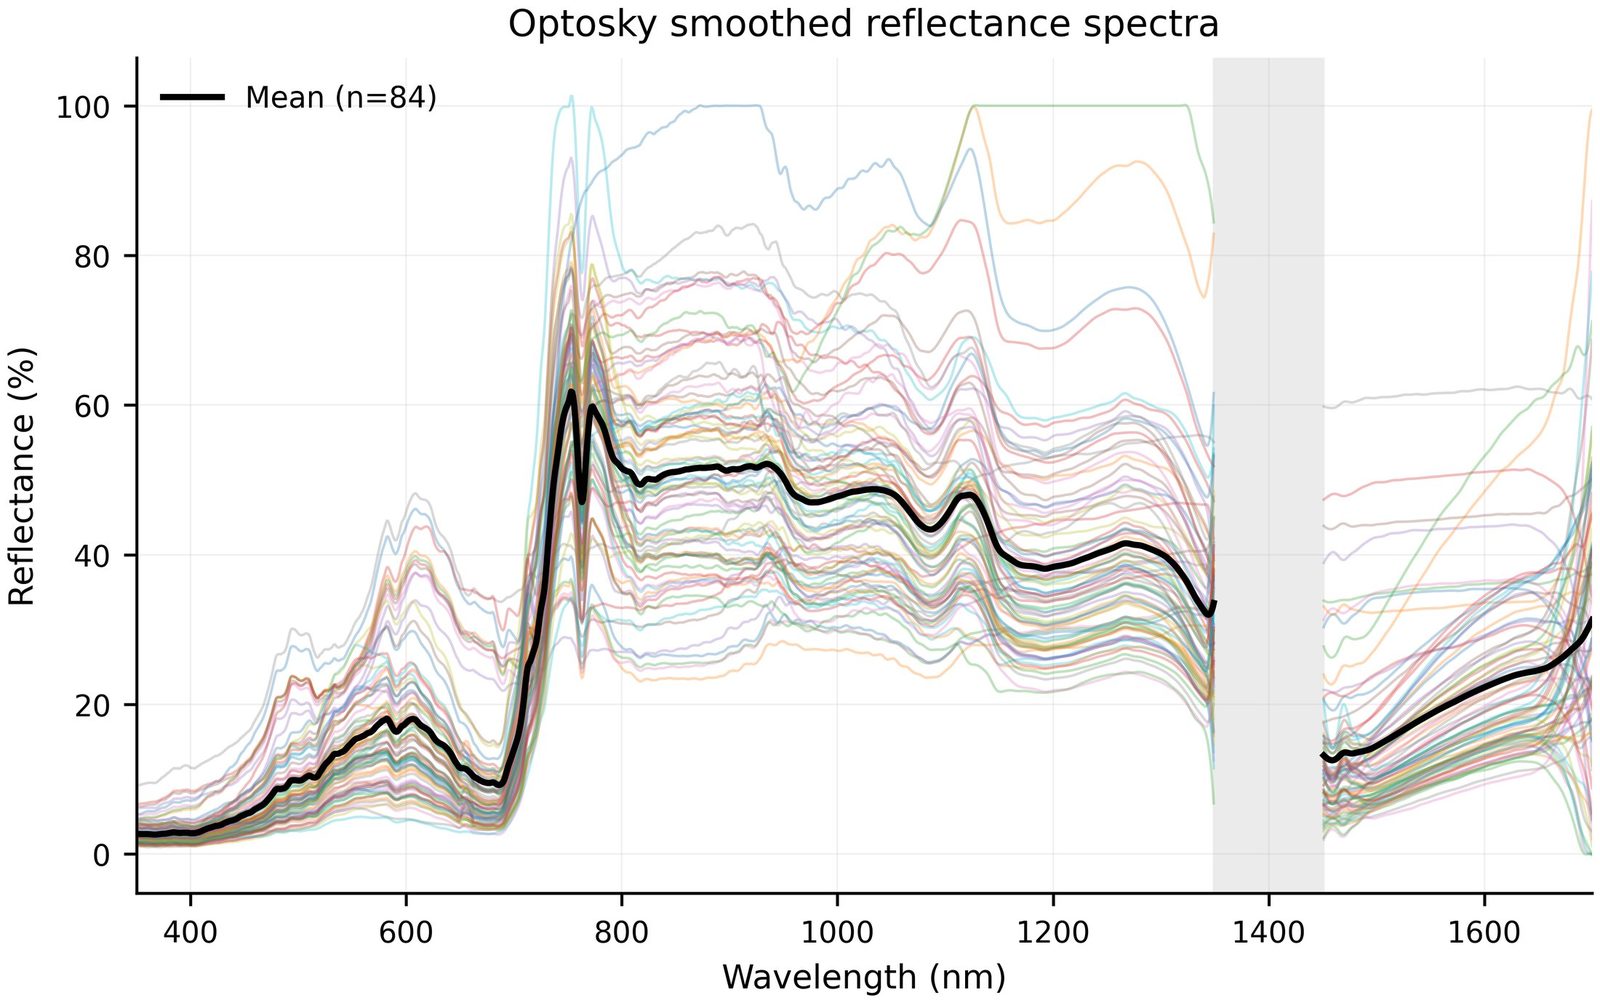
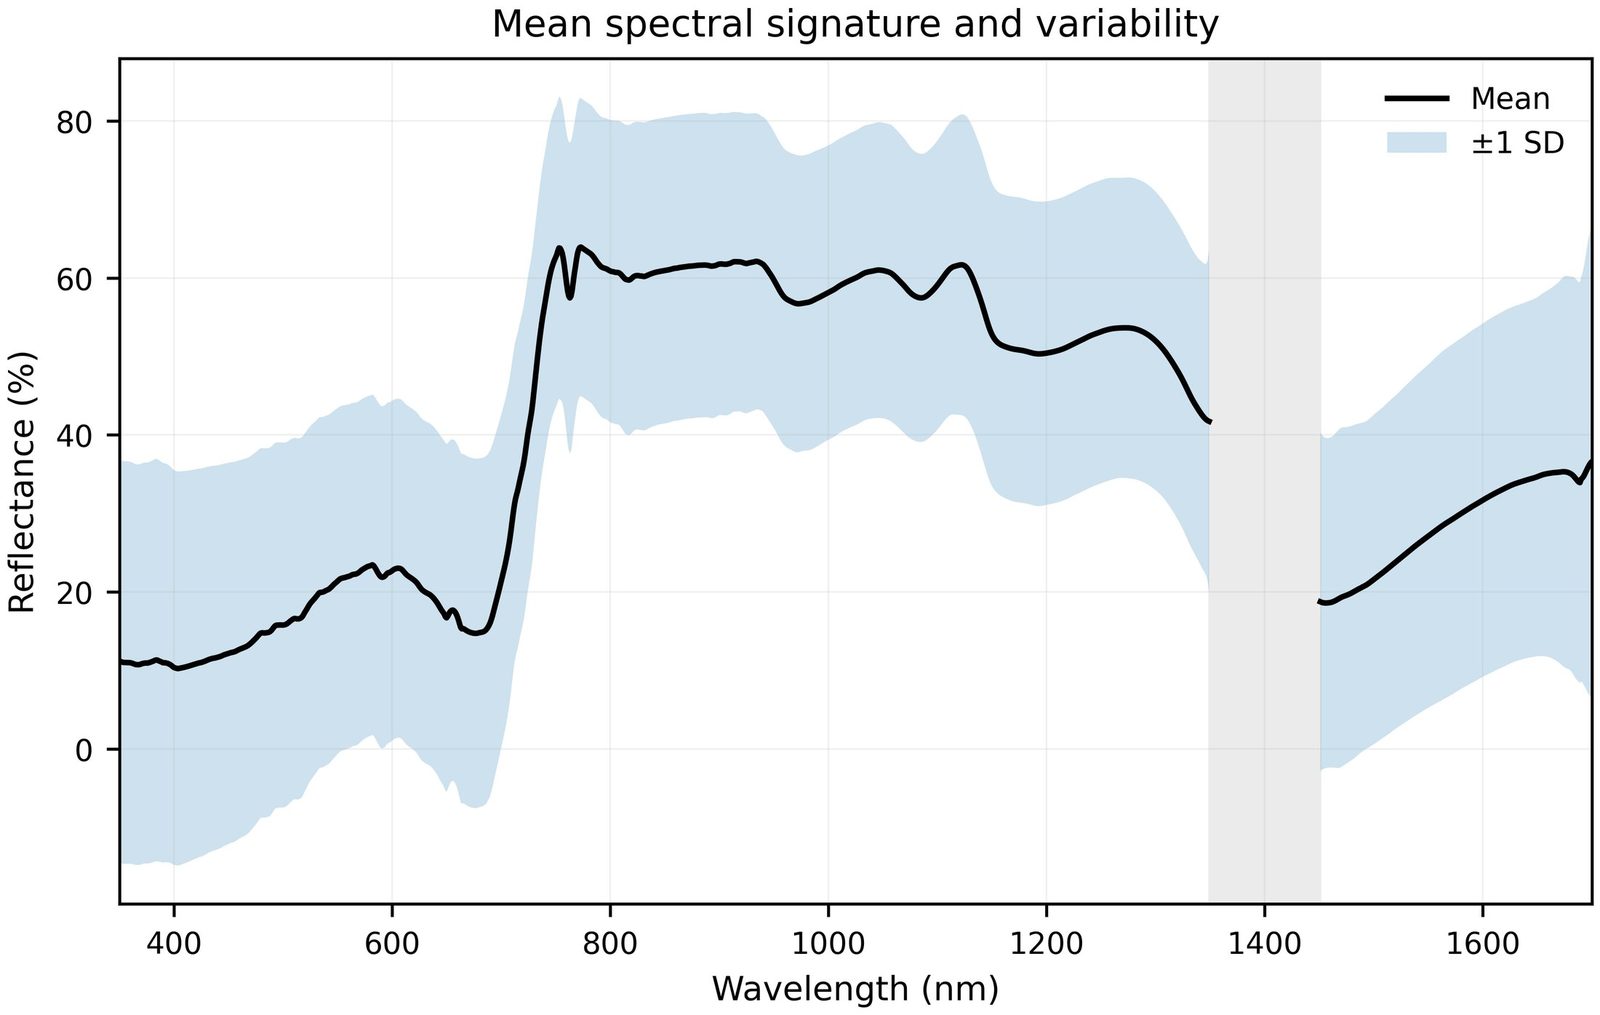
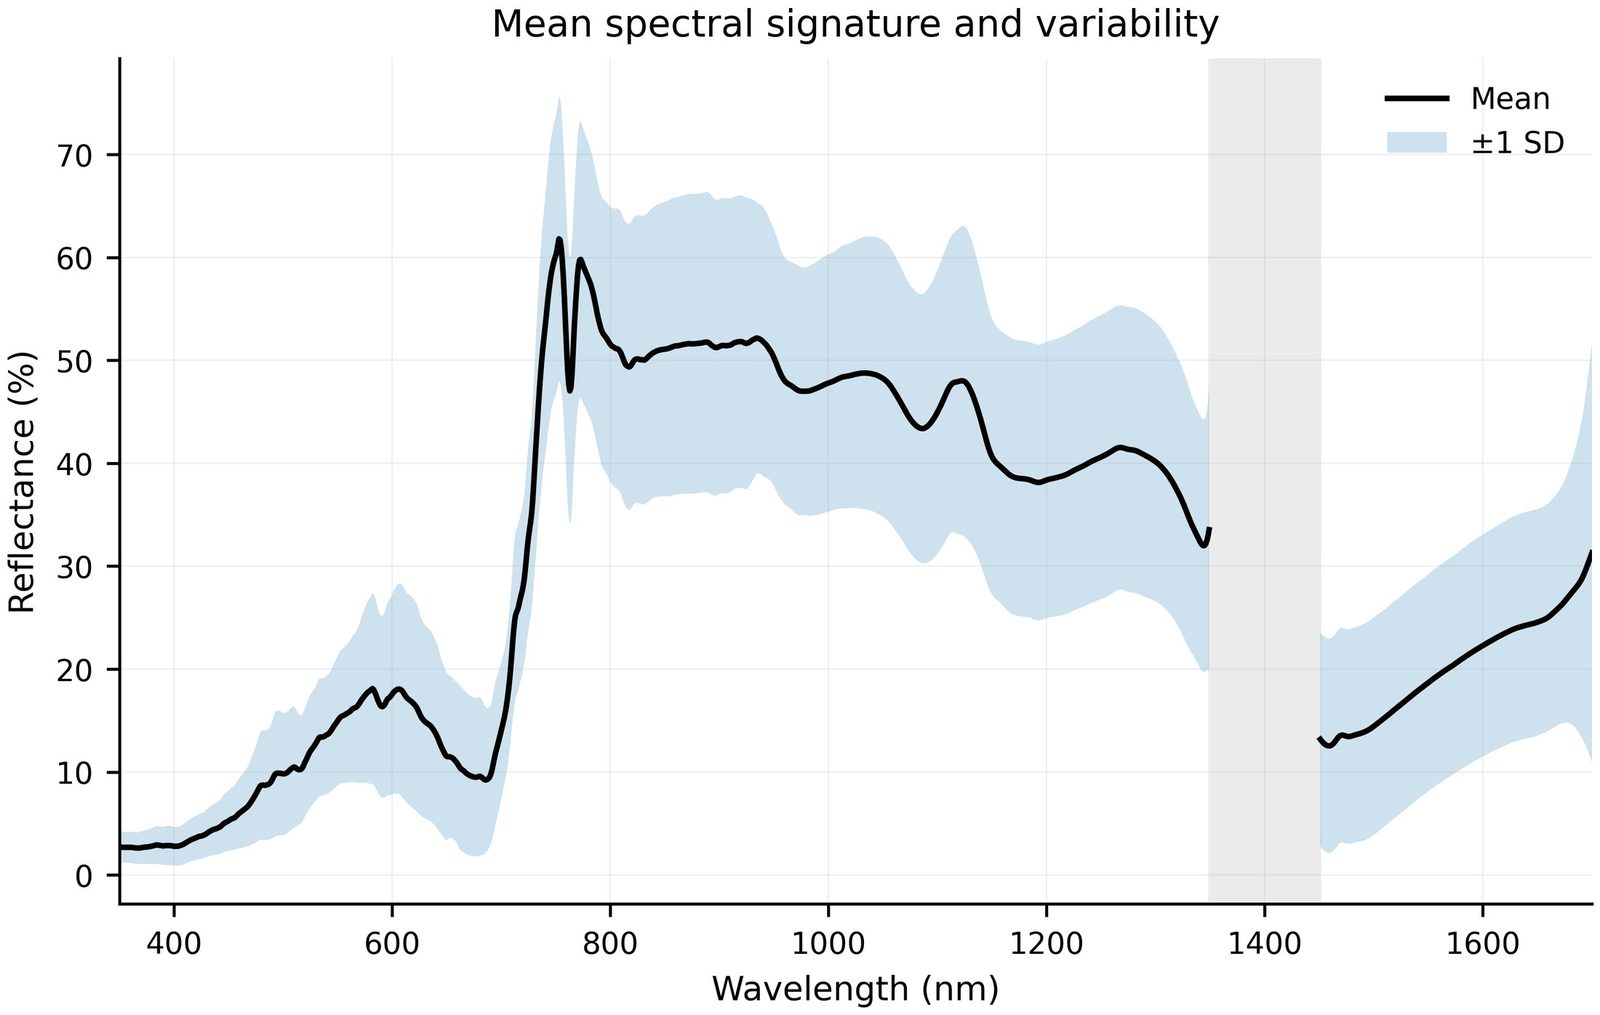
Red-edge, PCA and Sentinel‑2 band equivalents
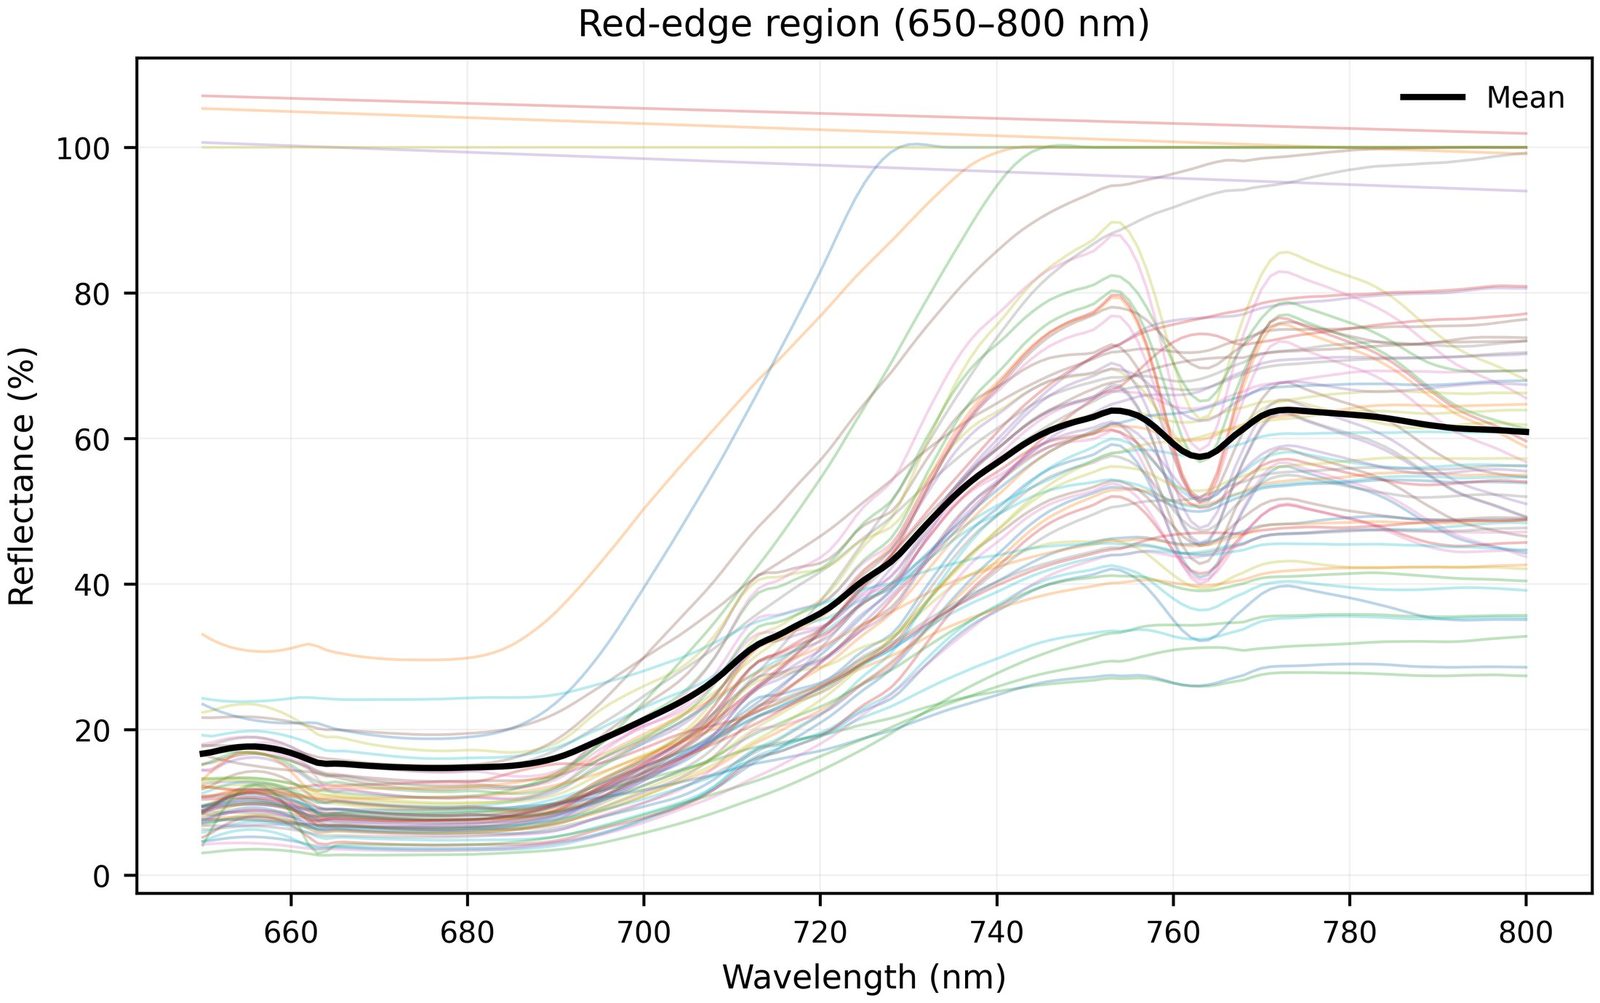
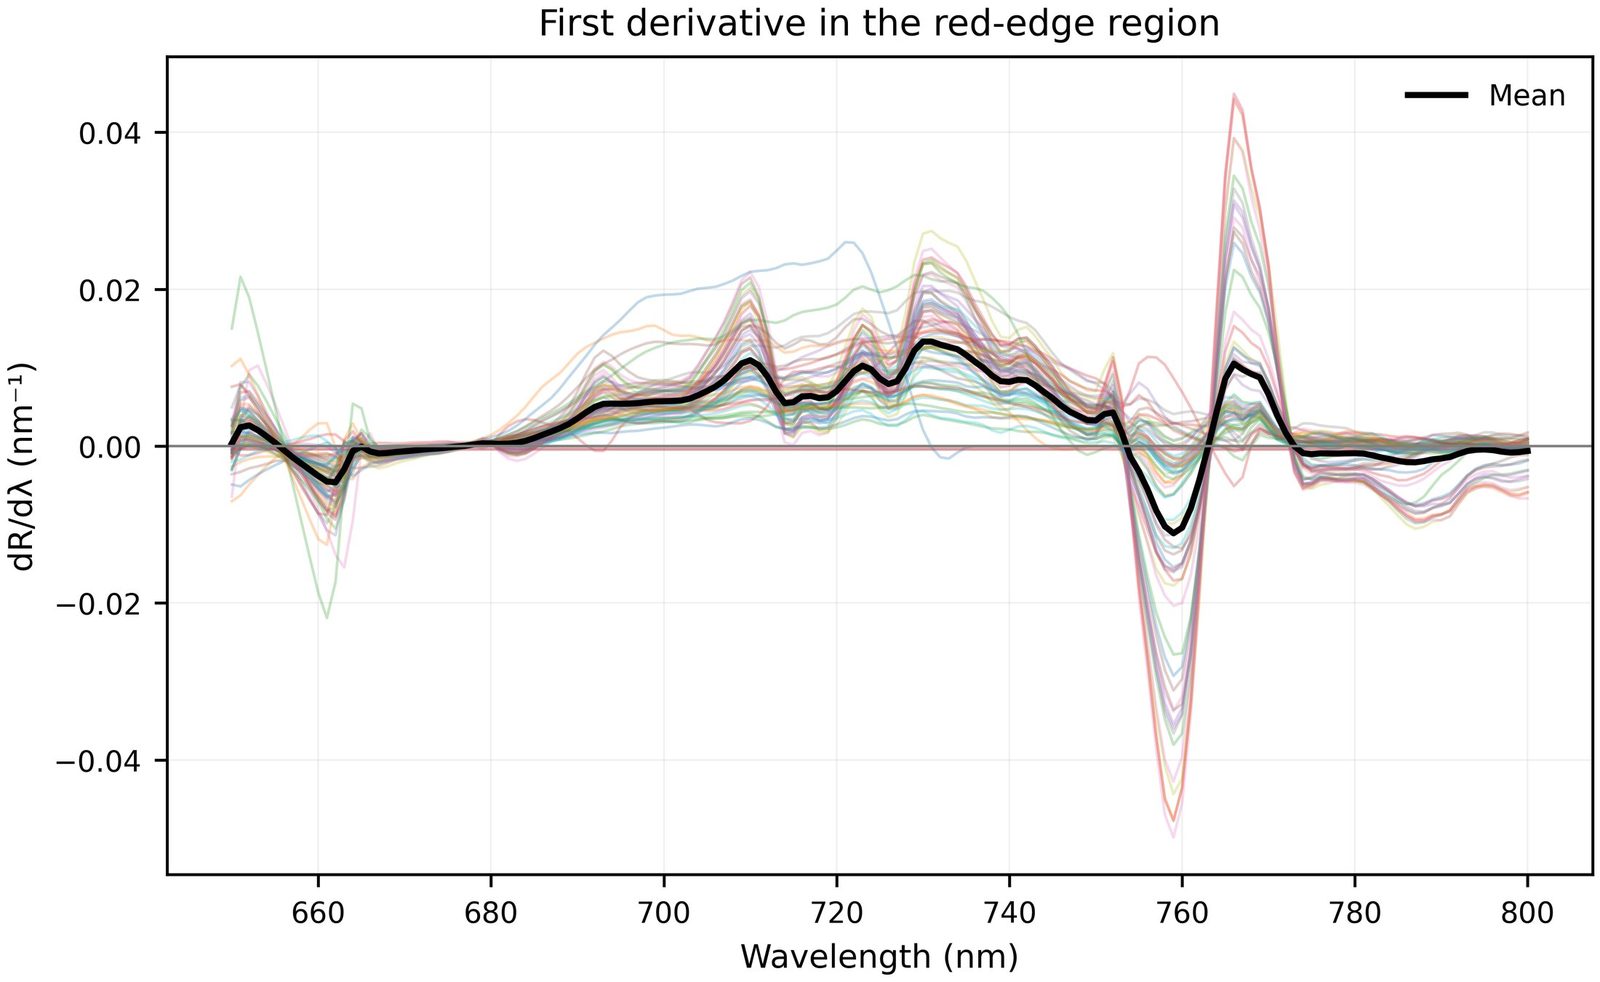
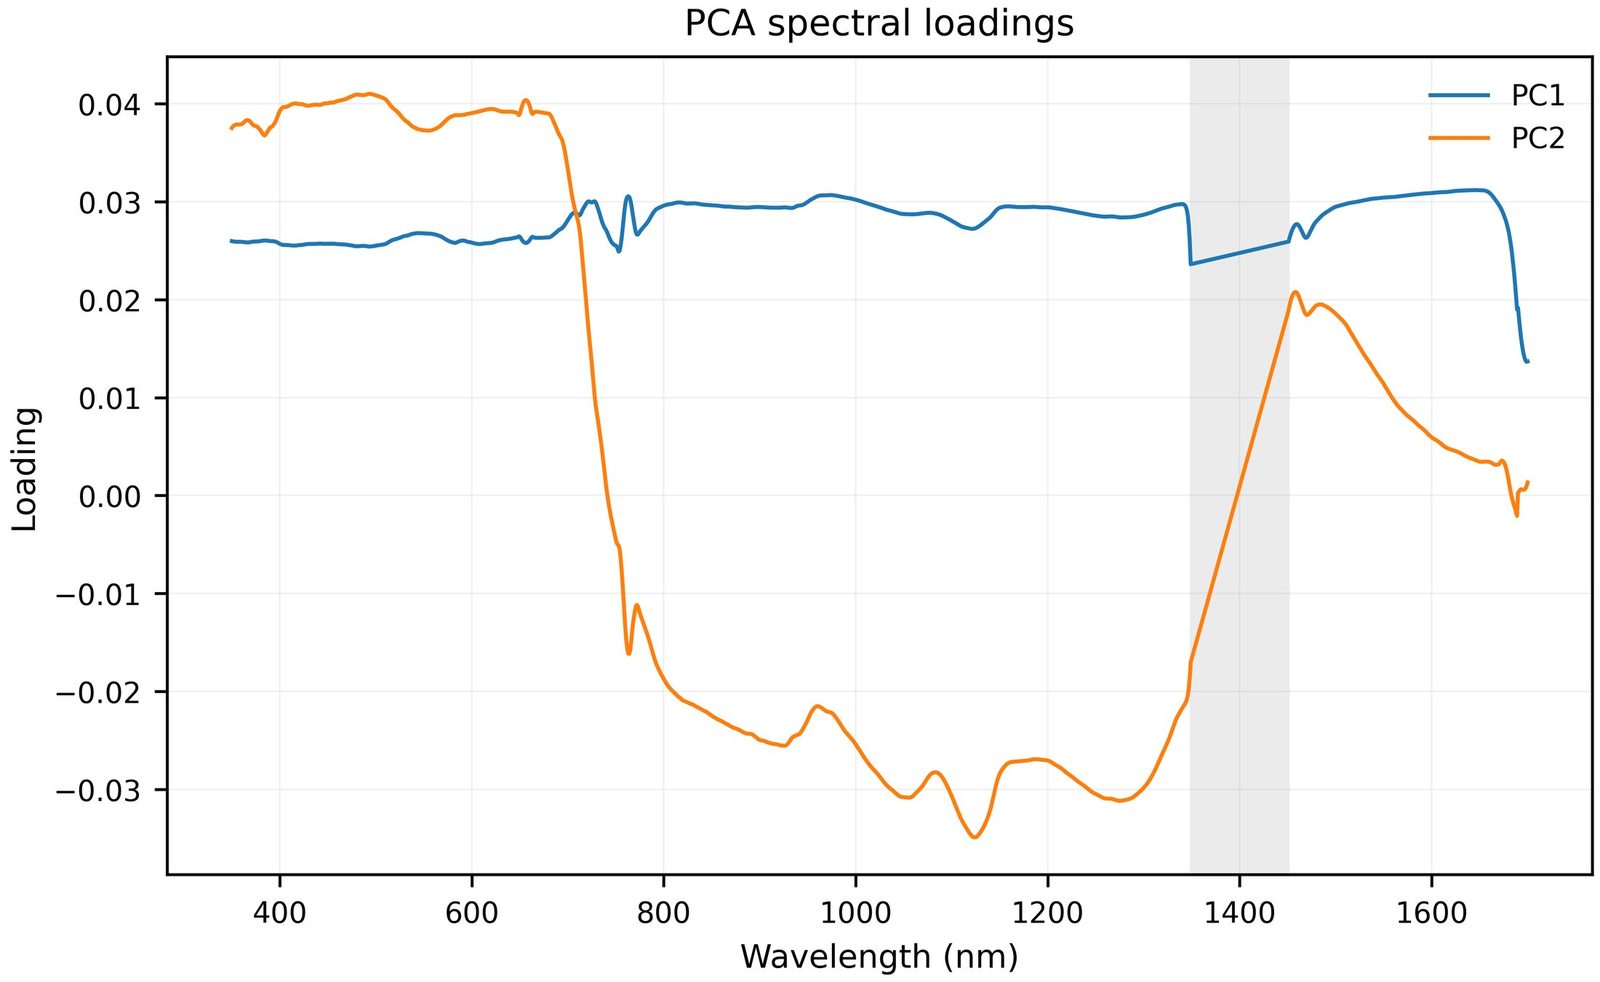
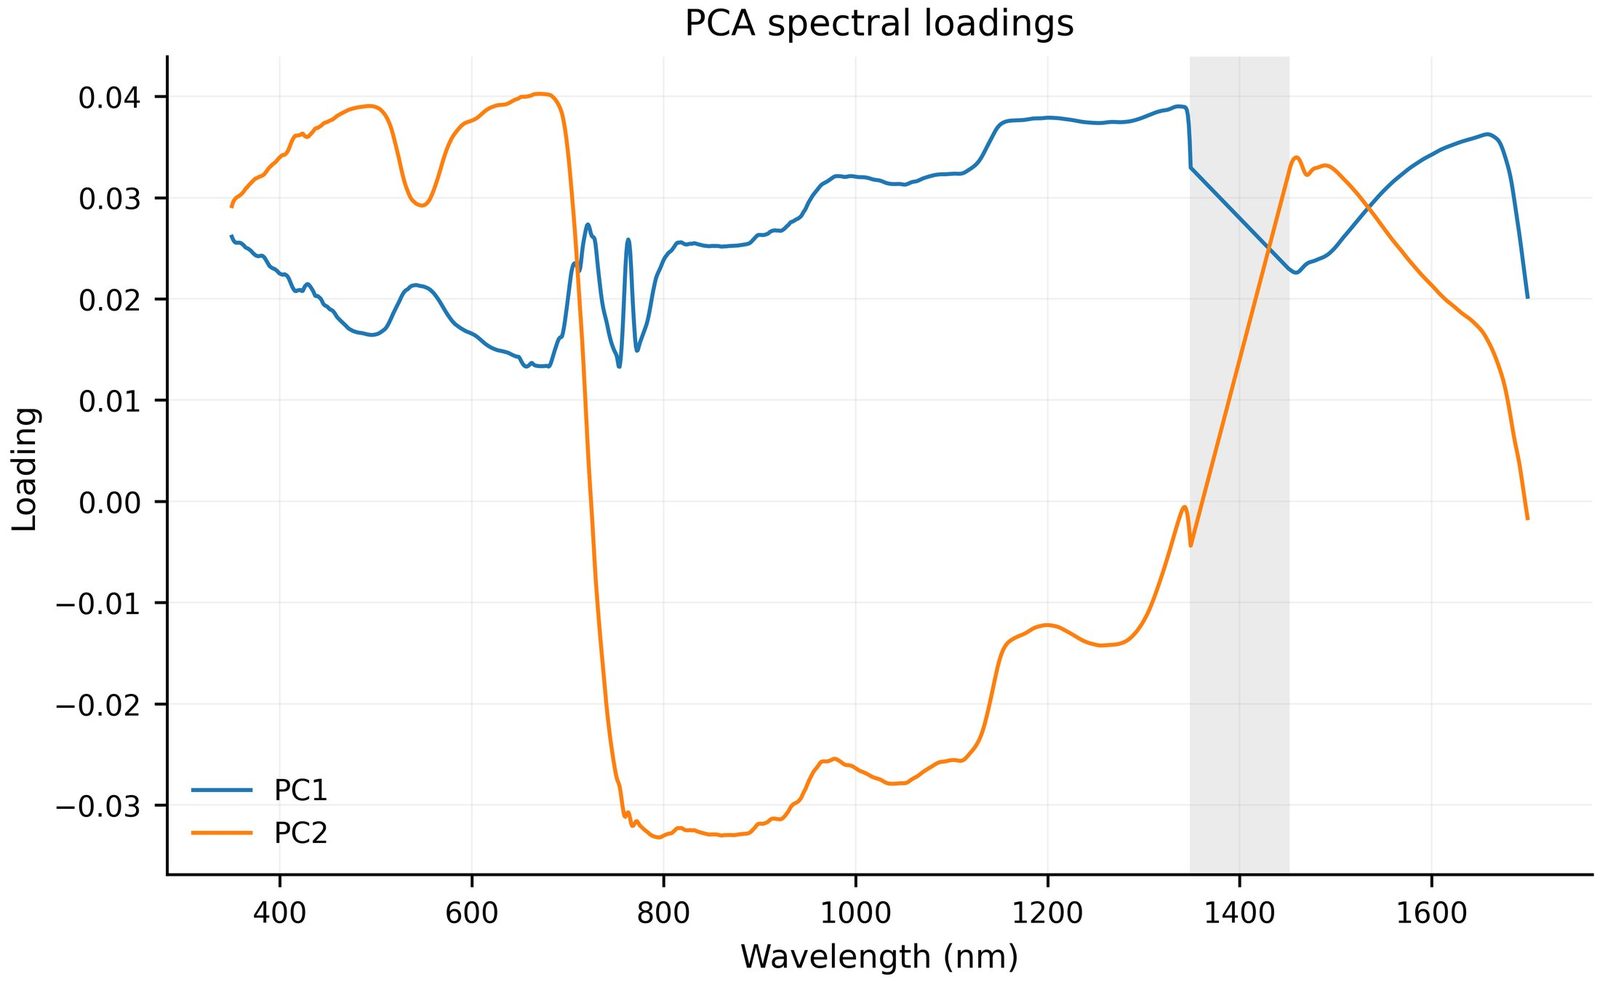
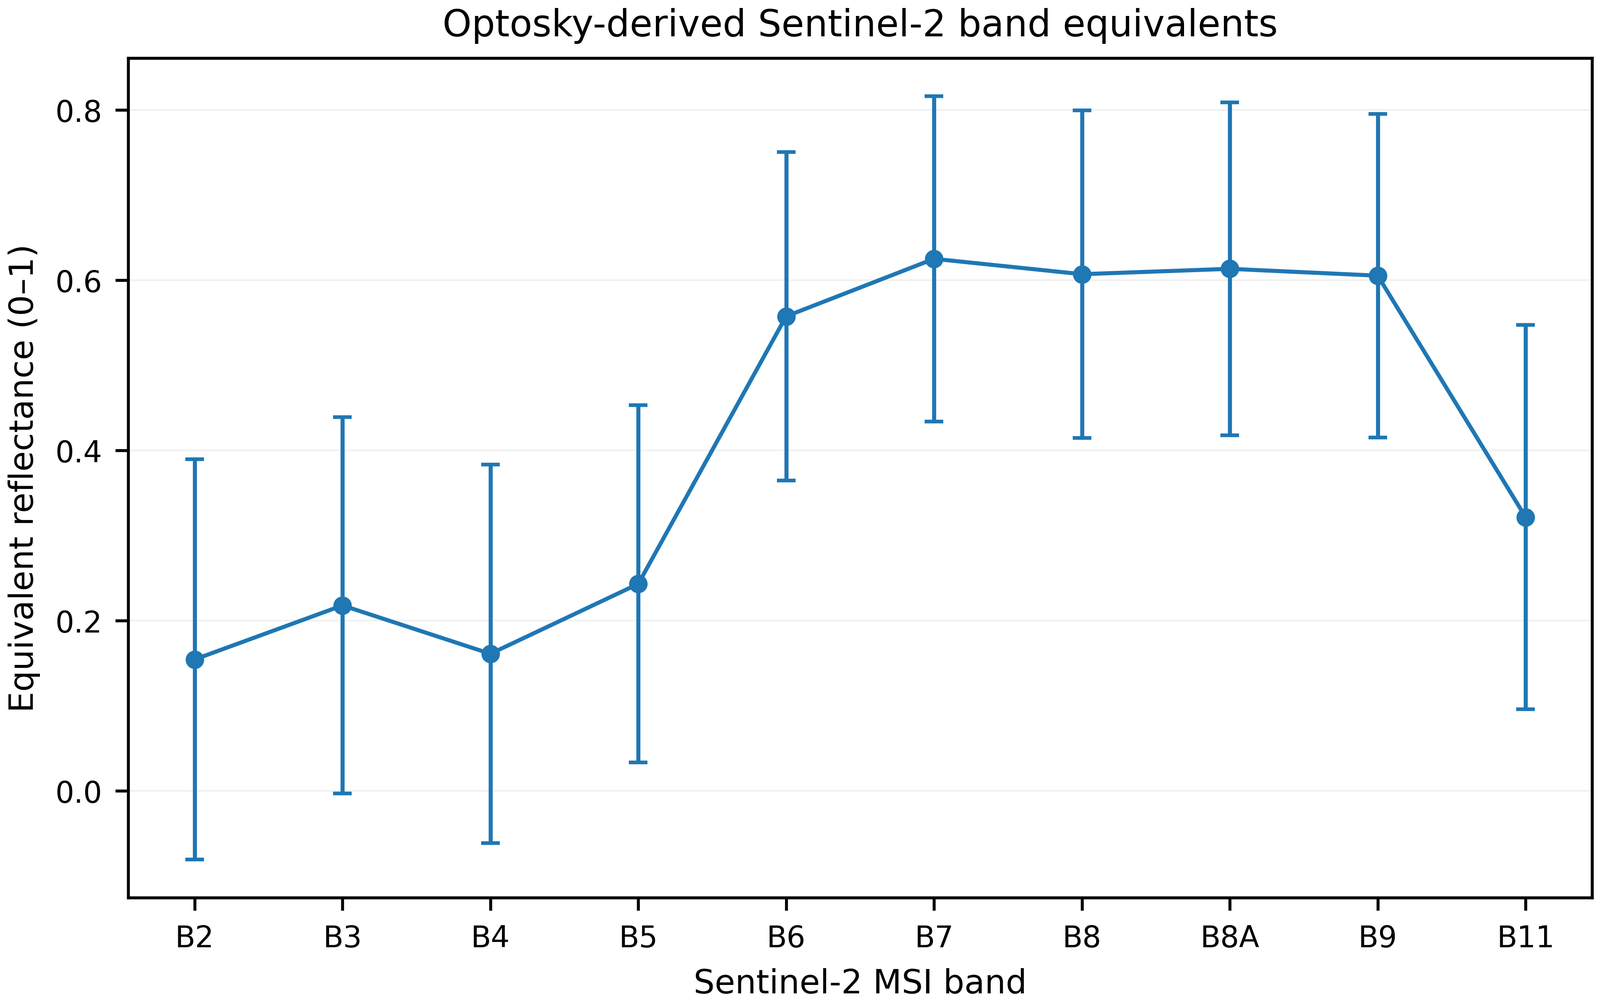
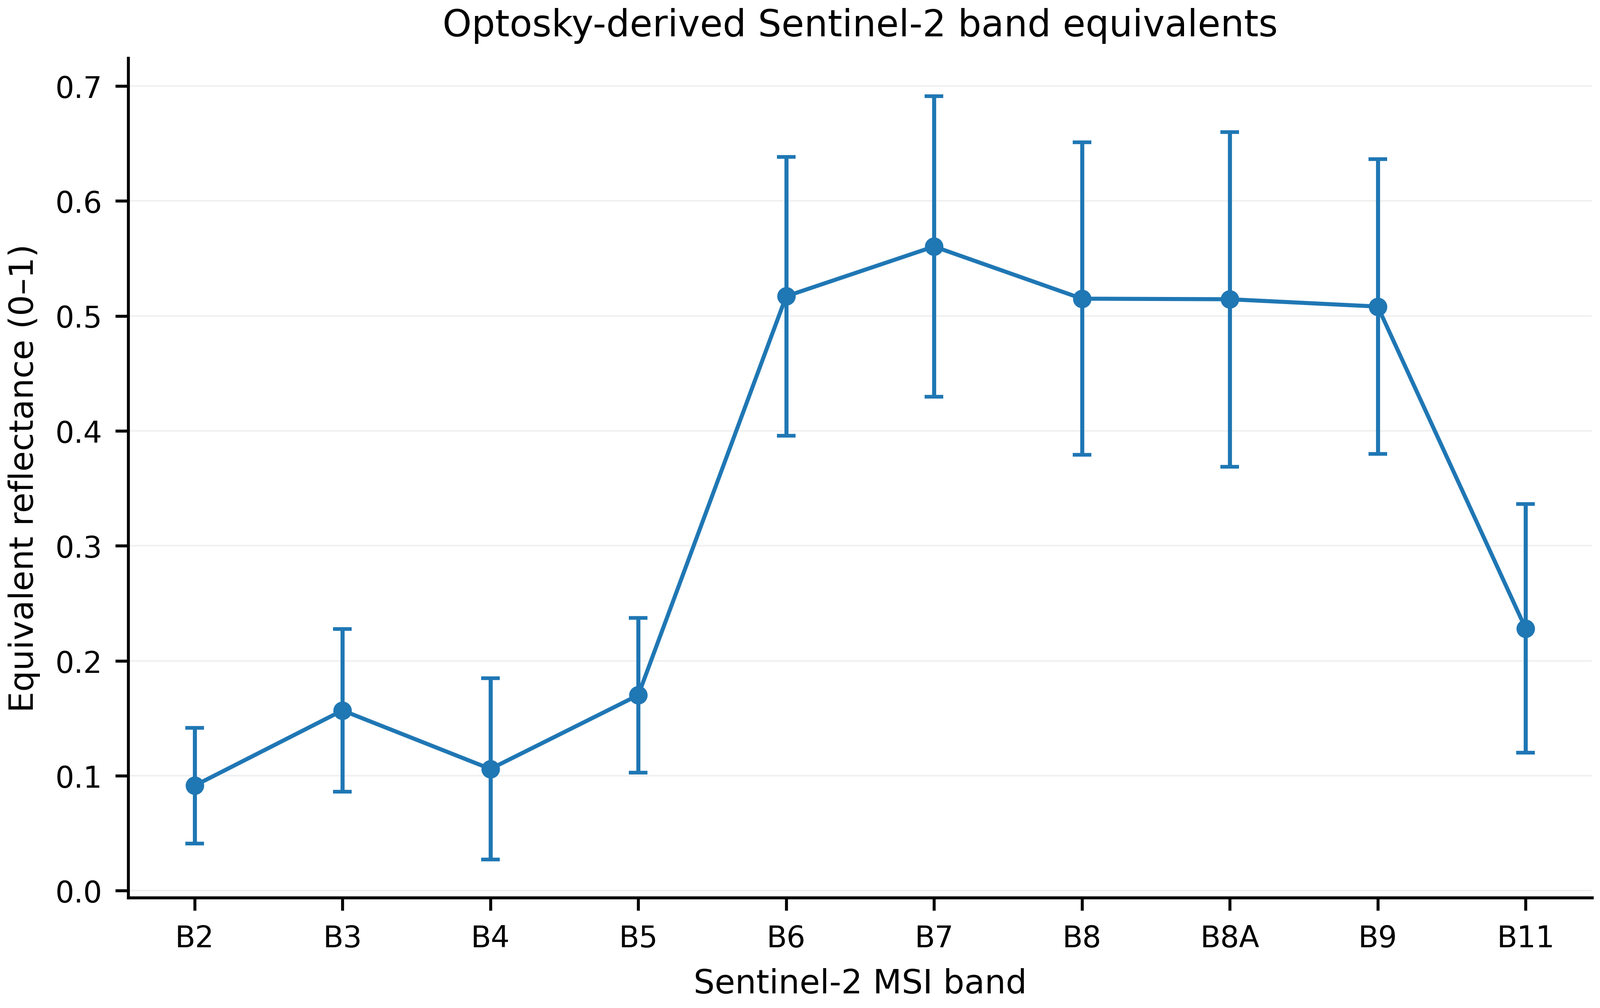
PC1 + PC2 explained 88.6–94.1 % of total variance; the O₂‑A artefact near 760 nm was separately controlled in red-edge calculations.
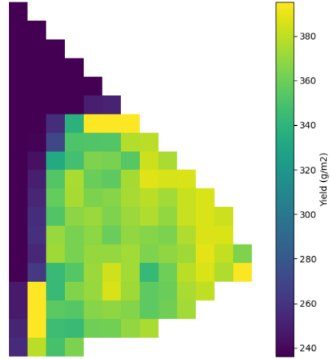
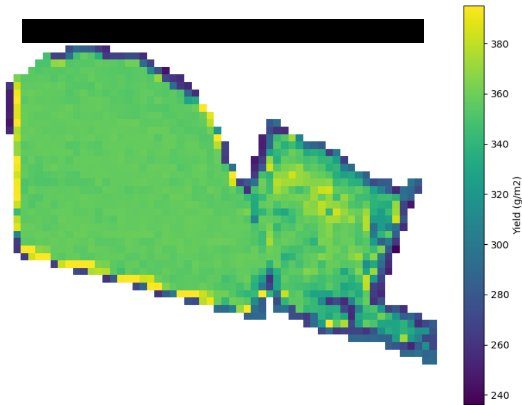
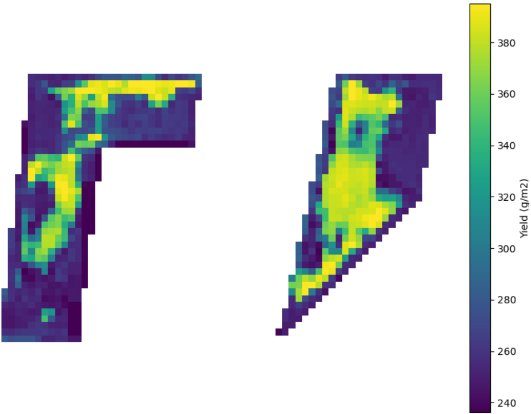
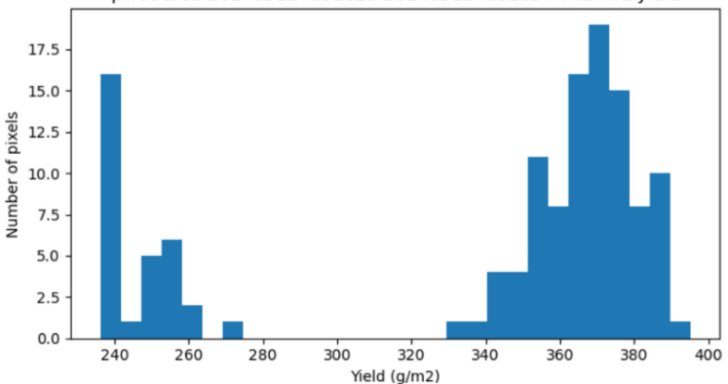
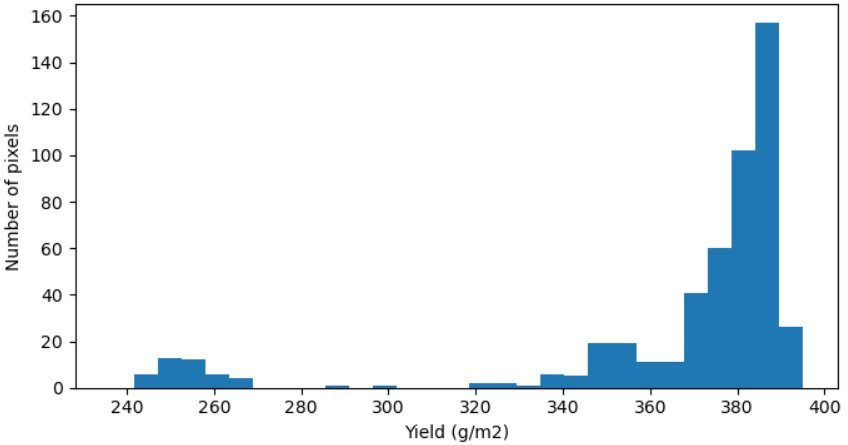
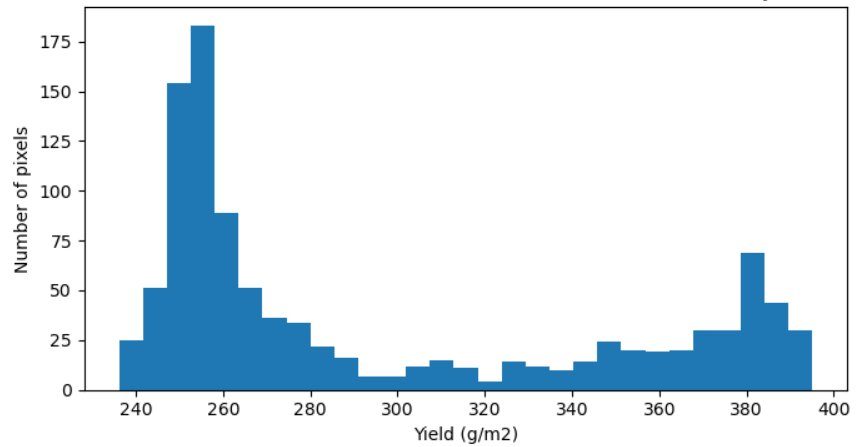
Model: seven mid-May Sentinel‑2 bands + five indices → ExtraTrees regression → cross-validation grouped by field and season.
Most important spectral features
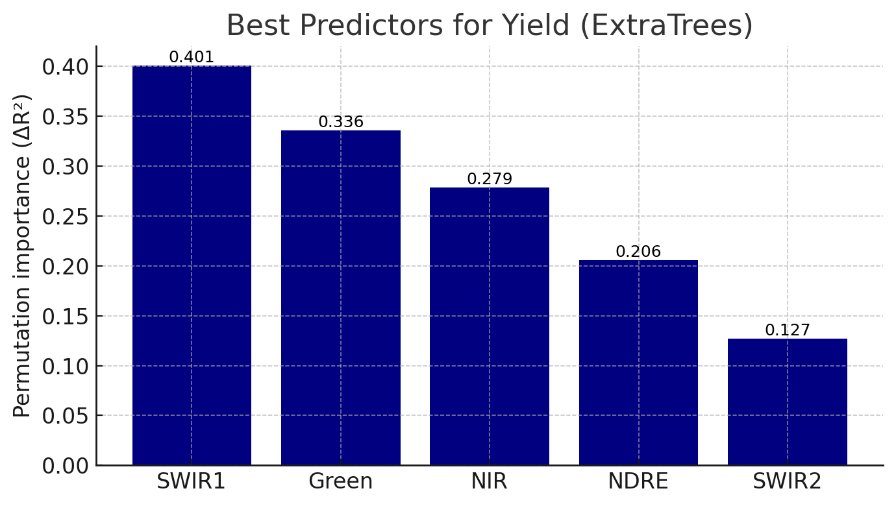
SWIR1 reflected canopy water status; green and NDRE reflected chlorophyll/nitrogen status; NIR reflected biomass and leaf area. Highest importance: SWIR1 (0.40), Green (0.34), NIR (0.28), NDRE (0.21), SWIR2 (0.13).
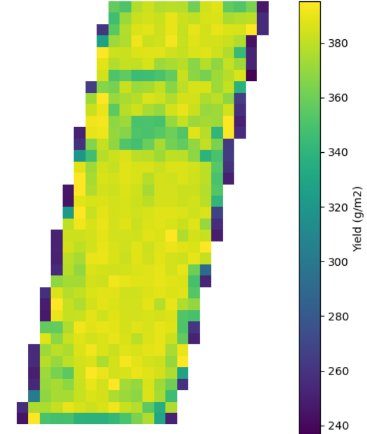
Spatial wheat yield prediction maps
Practical recommendations and implementation directions
Phosphorus
Soil-test-based, contour-wise differentiated P fertilization in phosphorus-deficient zones.
Water
Do not use optical indices in place of soil moisture; combine Sentinel‑1, sensors and the irrigation log.
Monitoring
Regularly track Sentinel‑2 time series in the heading–grain filling window.
Management zones
Use yield and soil maps for control sampling and variable-rate application.
Model validation
Update the model with independent 2026 data, spatial CV and calibrated absolute yield.
Training and services
Integrate the spectral library, protocols and GIS products into teaching and advisory services.
Materials and downloads
Final report
PDF/DOCX, 2023–2026
Monograph
Cover, ISBN and PDF
Field protocols
Soil, spectra, yield, QC
Maps
PNG/PDF/GeoTIFF and legends
Datasets
CSV/XLSX, metadata and licence
Newsletters
By year and language
Intellectual property
Certificate and short description
Presentations
Seminars, conferences, trainings
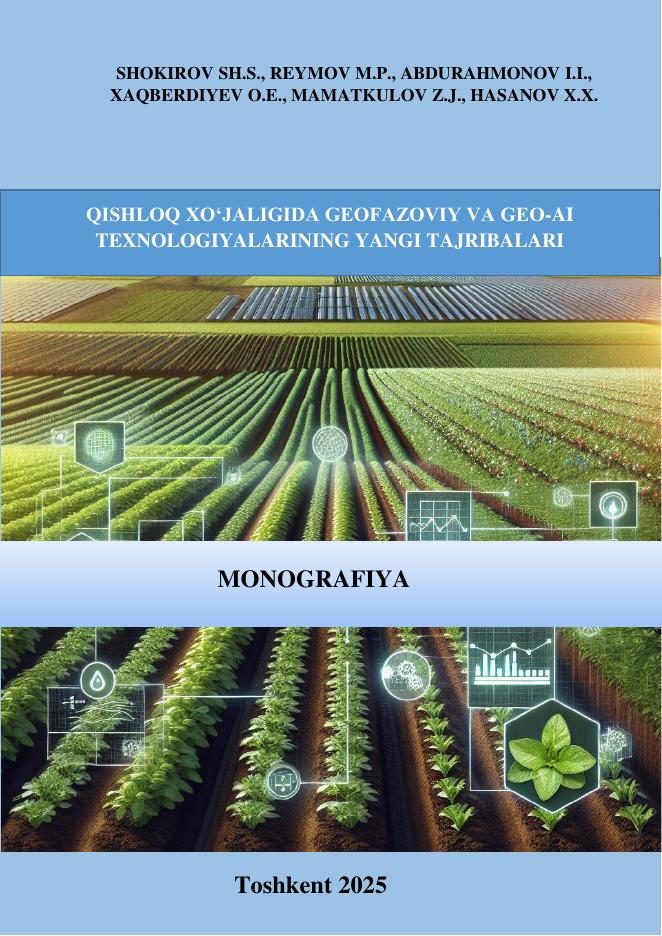
New experience of geospatial and Geo‑AI technologies in agriculture
Sh.S. Shokirov, M.P. Reymov, I.I. Abdurahmonov, O.E. Xaqberdiyev, Z.J. Mamatkulov, X.X. Hasanov
Tashkent: TIIAME NRU, 2025 — 86 pp. · ISBN 978-9910-8486-7-4
- Field and data collection methodology
- Soil analysis and spatial mapping
- Sentinel‑2 and soil moisture
- Spectral library
- Yield prediction with machine learning
Datasets, maps and protocols
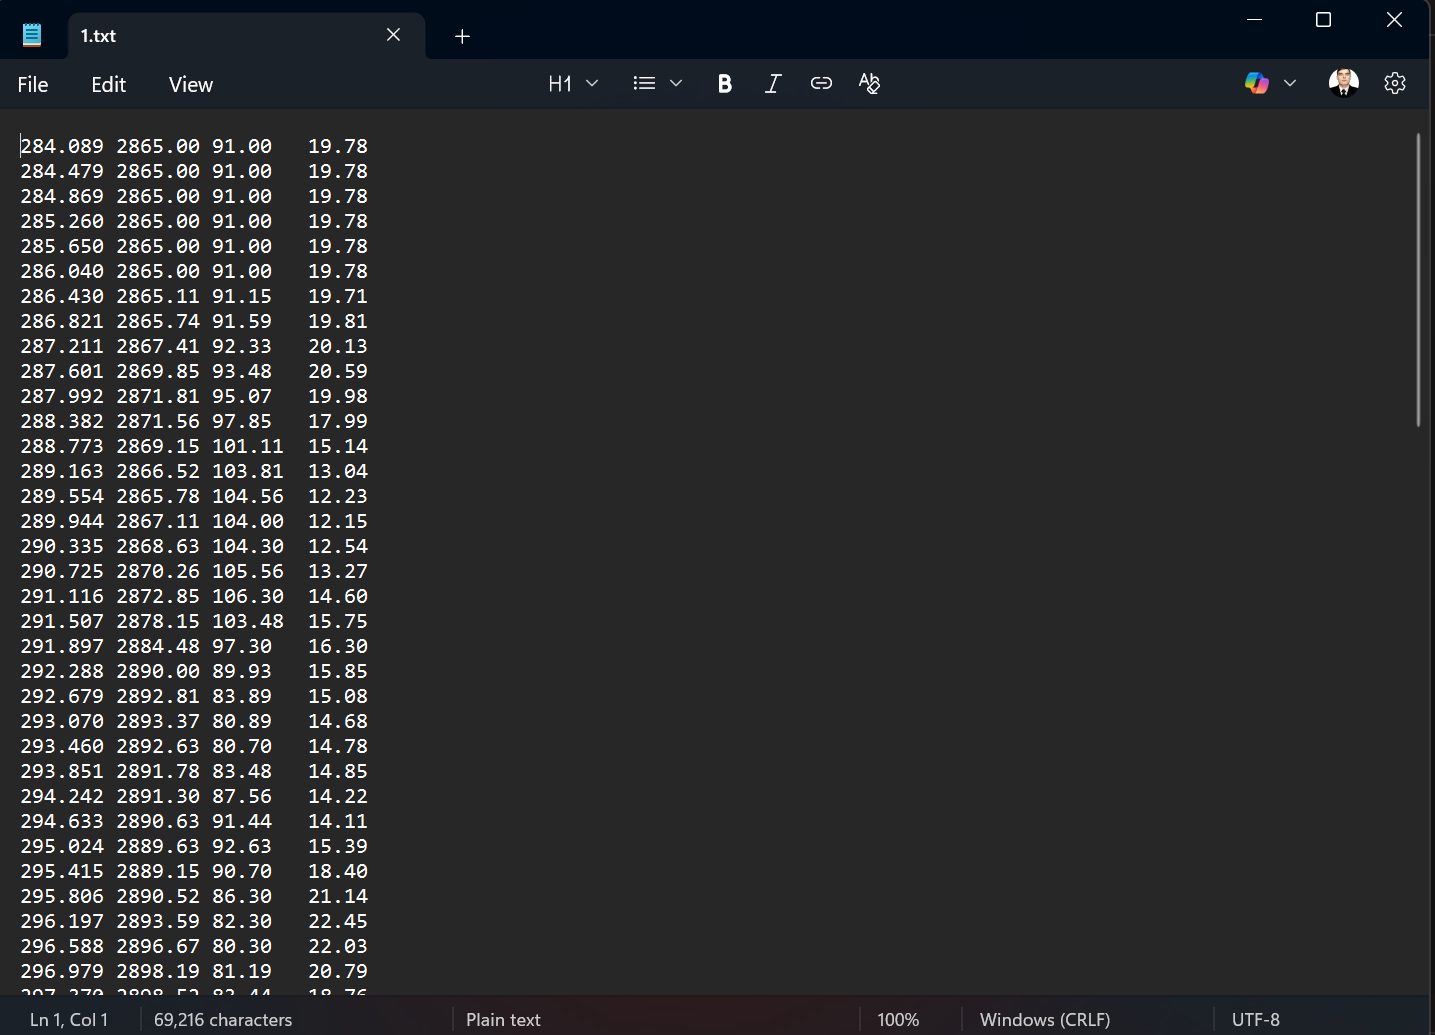
Protocols: sampling, laboratory, spectra, 1 m² yield. A data dictionary and version log are provided; licence and personal/restricted data are separated.
Intellectual property objects
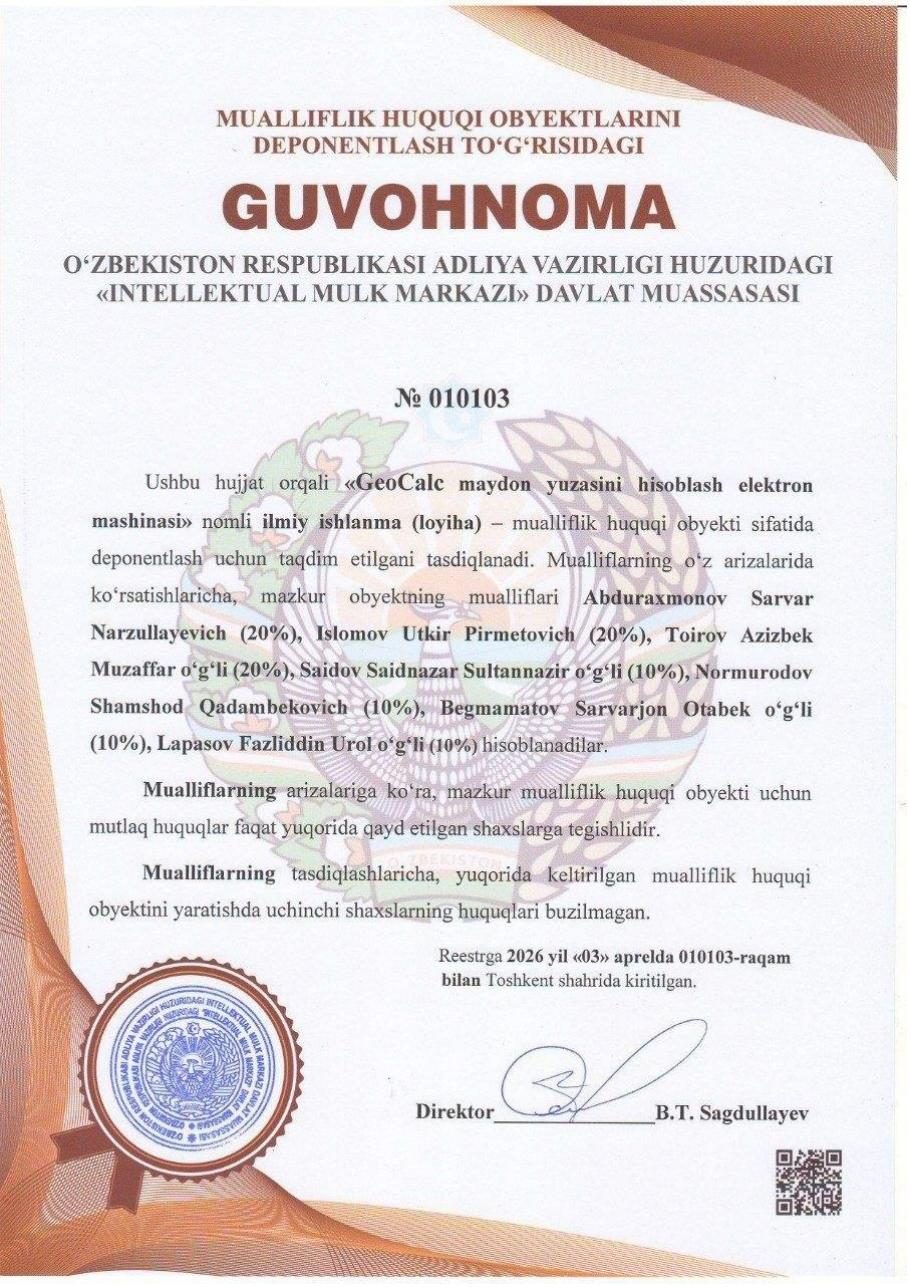
Textbooks and study guides
- Geoinformation cartography
- Modelling reservoirs with geoinformation technologies
- Geodetic metrology
- Cadastre of protected natural areas
- Geoecological mapping
- Space geodesy
- Scientific Foundations of Geoinformation Systems
Scientific capacity and training
On the project topic and related fields, 1 DSc (S.N. Abdurakhmonov, 30.04.2026), 1 PhD (R.I. Makhsudov) and 2 master’s theses were defended.
Project publications and scientific outputs
Annual dynamics: 12 → 20 → 44 scientific outputs (2023 → 2025).
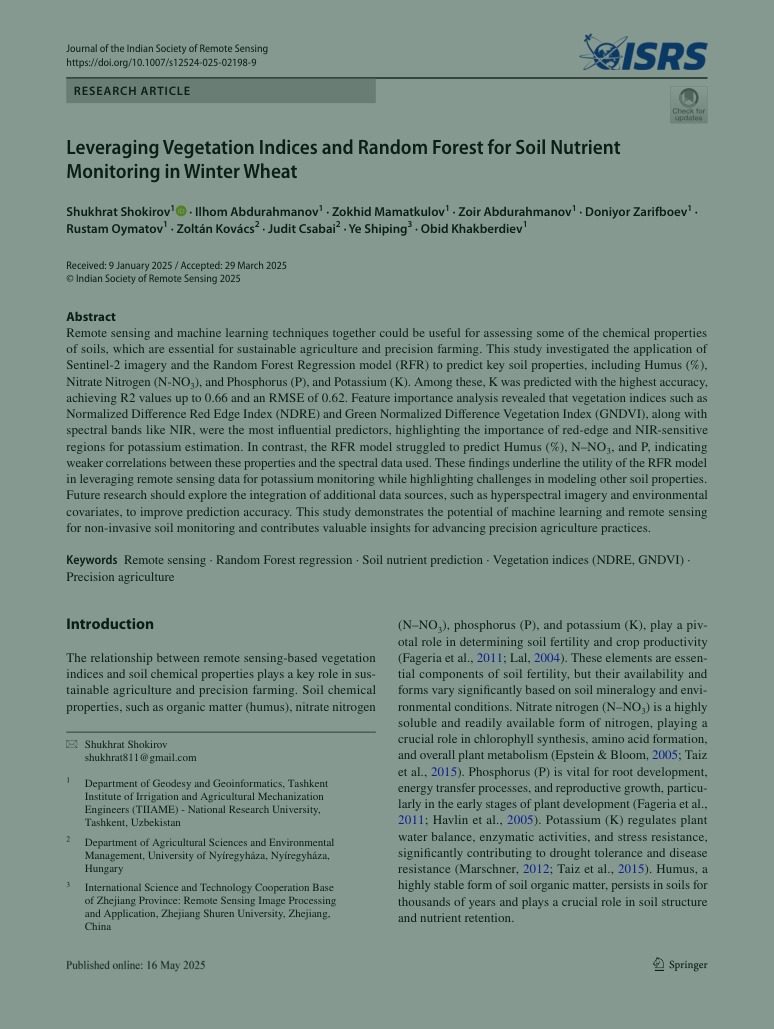
DOI-verified publications
- DOI: 10.1007/s12524-025-02198-9 ↗
Leveraging Vegetation Indices and Random Forest for Soil Nutrient Monitoring in Winter Wheat
Journal of the Indian Society of Remote Sensing, 2025
- DOI: 10.1051/e3sconf/202459001009 ↗
The effect of fermented poultry manure on the yield and quality parameters of triticale cultivated organic way on acidic sandy soil
E3S Web of Conferences 590, 01009, 2024
- DOI: 10.1063/5.0266743 ↗
Temporal Evolution of Climate-Related Land Changes in Zarafshan Valley: MODIS and Google Earth Engine Perspective
AIP Conference Proceedings 3256, 040016, 2025
- DOI: 10.1051/e3sconf/202459005002 ↗
Search for the lost Baghi Chinar garden in the Samarkand region and creation of a Digital Terrain Model
E3S Web of Conferences 590, 05002, 2024
- DOI: 10.1051/e3sconf/202459005007 ↗
Sustainable development of Turkmenistan in the context of climate change
E3S Web of Conferences 590, 05007, 2024
- DOI: 10.46666/2024-3.2708-9991.14 ↗
Land use and land management in Kazakhstan
Problems of AgriMarket, No. 3, 2024
- DOI: 10.5194/isprs-archives-XLVIII-5-W3-2025-63-2025 ↗
Theoretical and Methodological Basis of Mapping the Ecological State of Irrigated Lands in the Conditions of Climate Change: Bibliometric Analysis
ISPRS Archives, 2025
2026 publications
- Multi-temporal monitoring of vegetation dynamics using Sentinel‑2 and Google Earth Engine — Proceedings of SPIE, 2026.
- Preparation and integration of spatial data in a GIS environment: the case of Boka and Middle Chirchiq — 2026.
- Spatial variability of soil agrochemical indicators and Trimble Juno 3B / ArcGIS Survey123 — Nukus, 2026.
- Soil fertility and fertilization efficiency using remote sensing and field analyses — 2026.
- Yield components of triticale with granulated poultry manure — Nyíregyháza international conference, 2026.
- Remote Sensing for Precision Agriculture in Arid and Semi-Arid Regions: A Case Study of Uzbekistan — Springer Nature book chapter, in preparation.
Visits and international cooperation
Scientific and practical visit to Hungary
Nyíregyháza, Budapest and Debrecen — conference, trainings, meetings with universities and agencies.

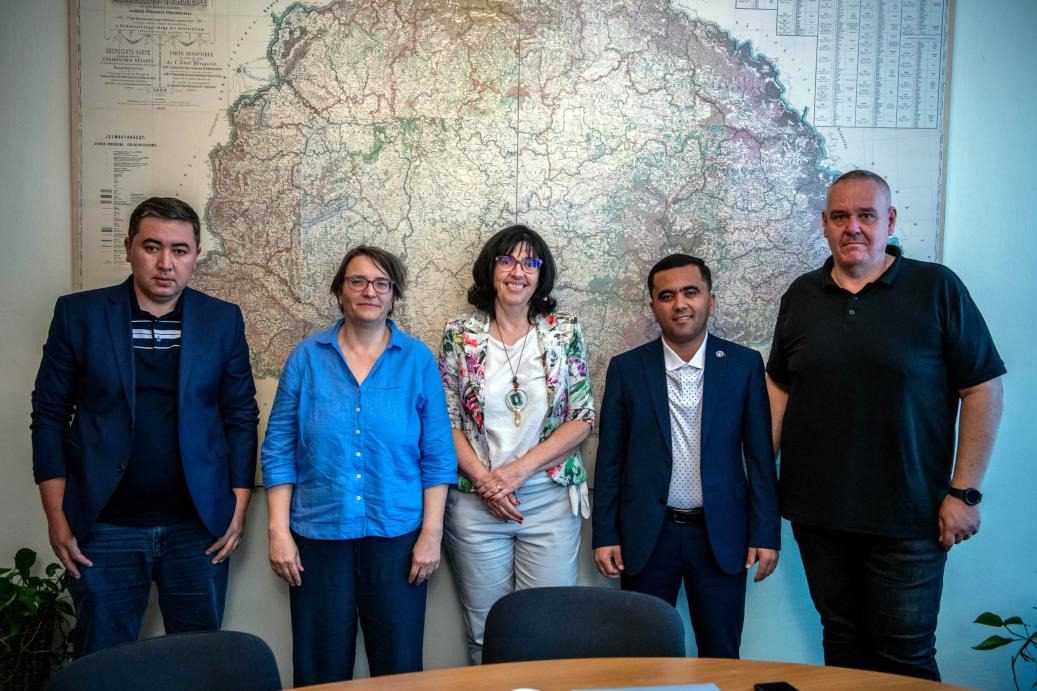
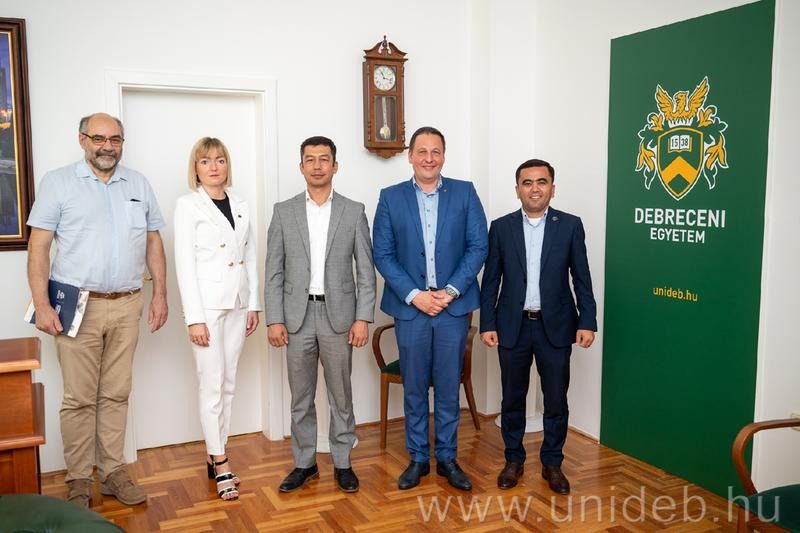
The “Sustainable Geospatial Solutions for a Changing World” conference and trainings at the University of Nyíregyháza.
Meeting with the Drought Prevention Institute and HEPA in Budapest. At Óbuda University — talks on remote sensing, drought mapping and a master’s programme.
At the University of Debrecen — cooperation in agriculture, water management, geoinformatics and IT.
Results of international cooperation
Scopus publications with Hungarian partners
Joint triticale results at the Nyíregyháza conference
Book chapter for Springer Nature (collaboration with Tsukuba University)
Meetings with universities and agencies in Hungary
Partner scientists: Judit Csabai, Zoltán Kovács, Edit Kosztyuné Krajnyák, Béla Szabó and others.
Project moments
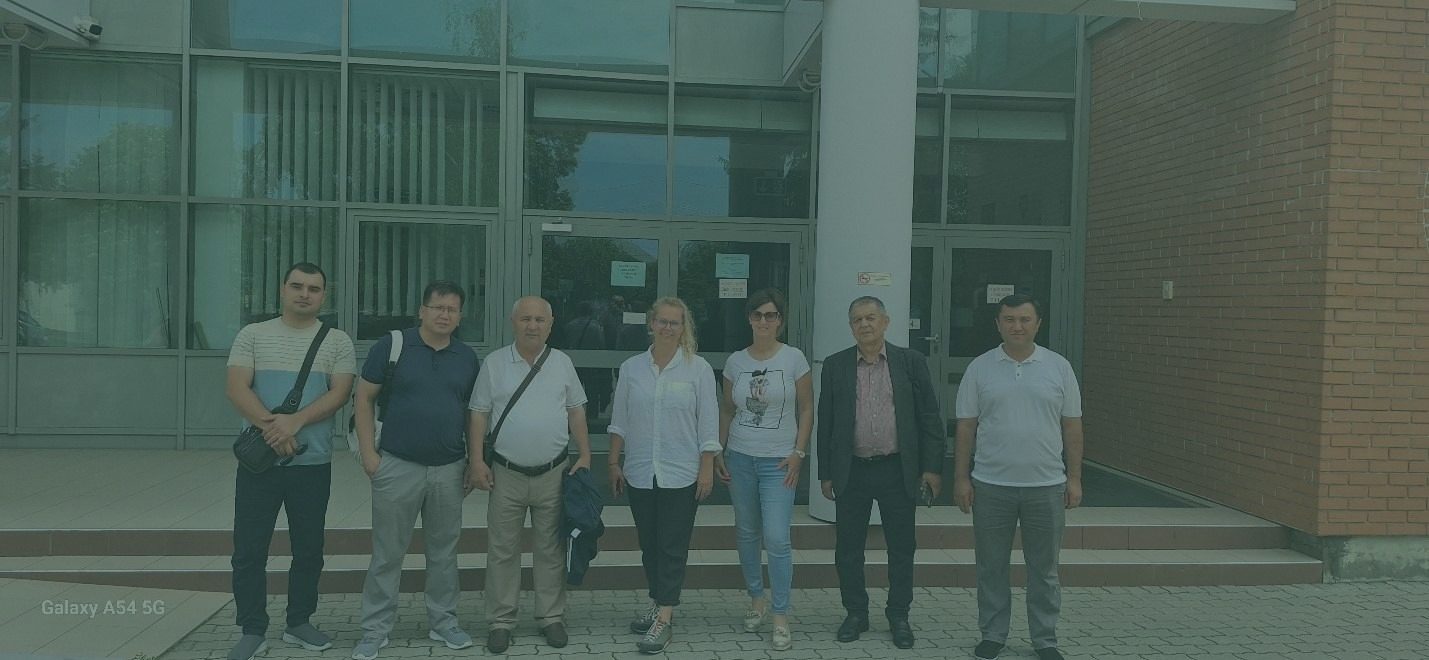
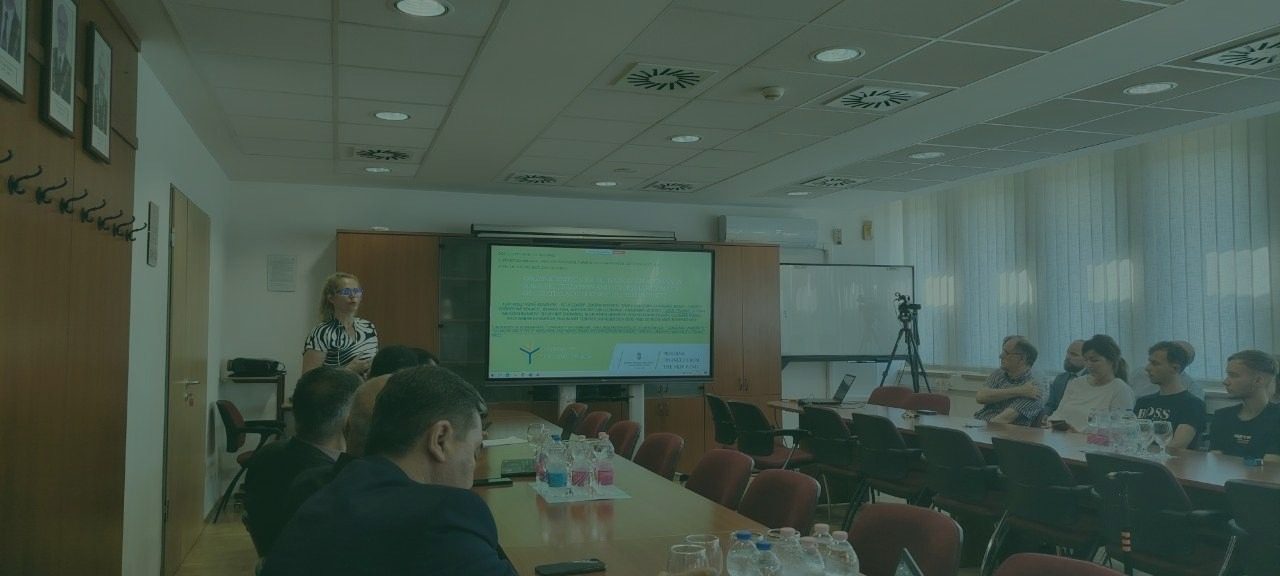
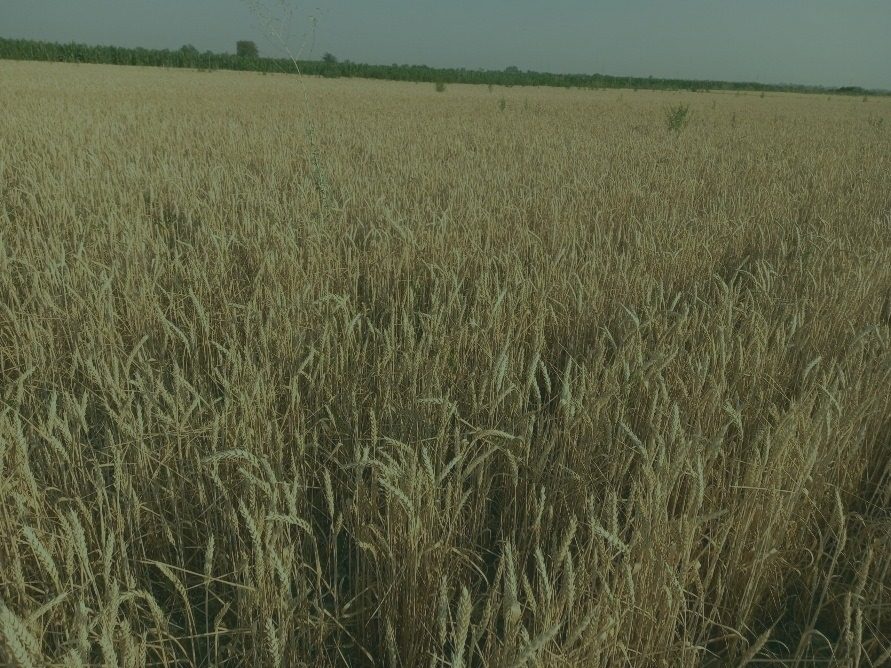
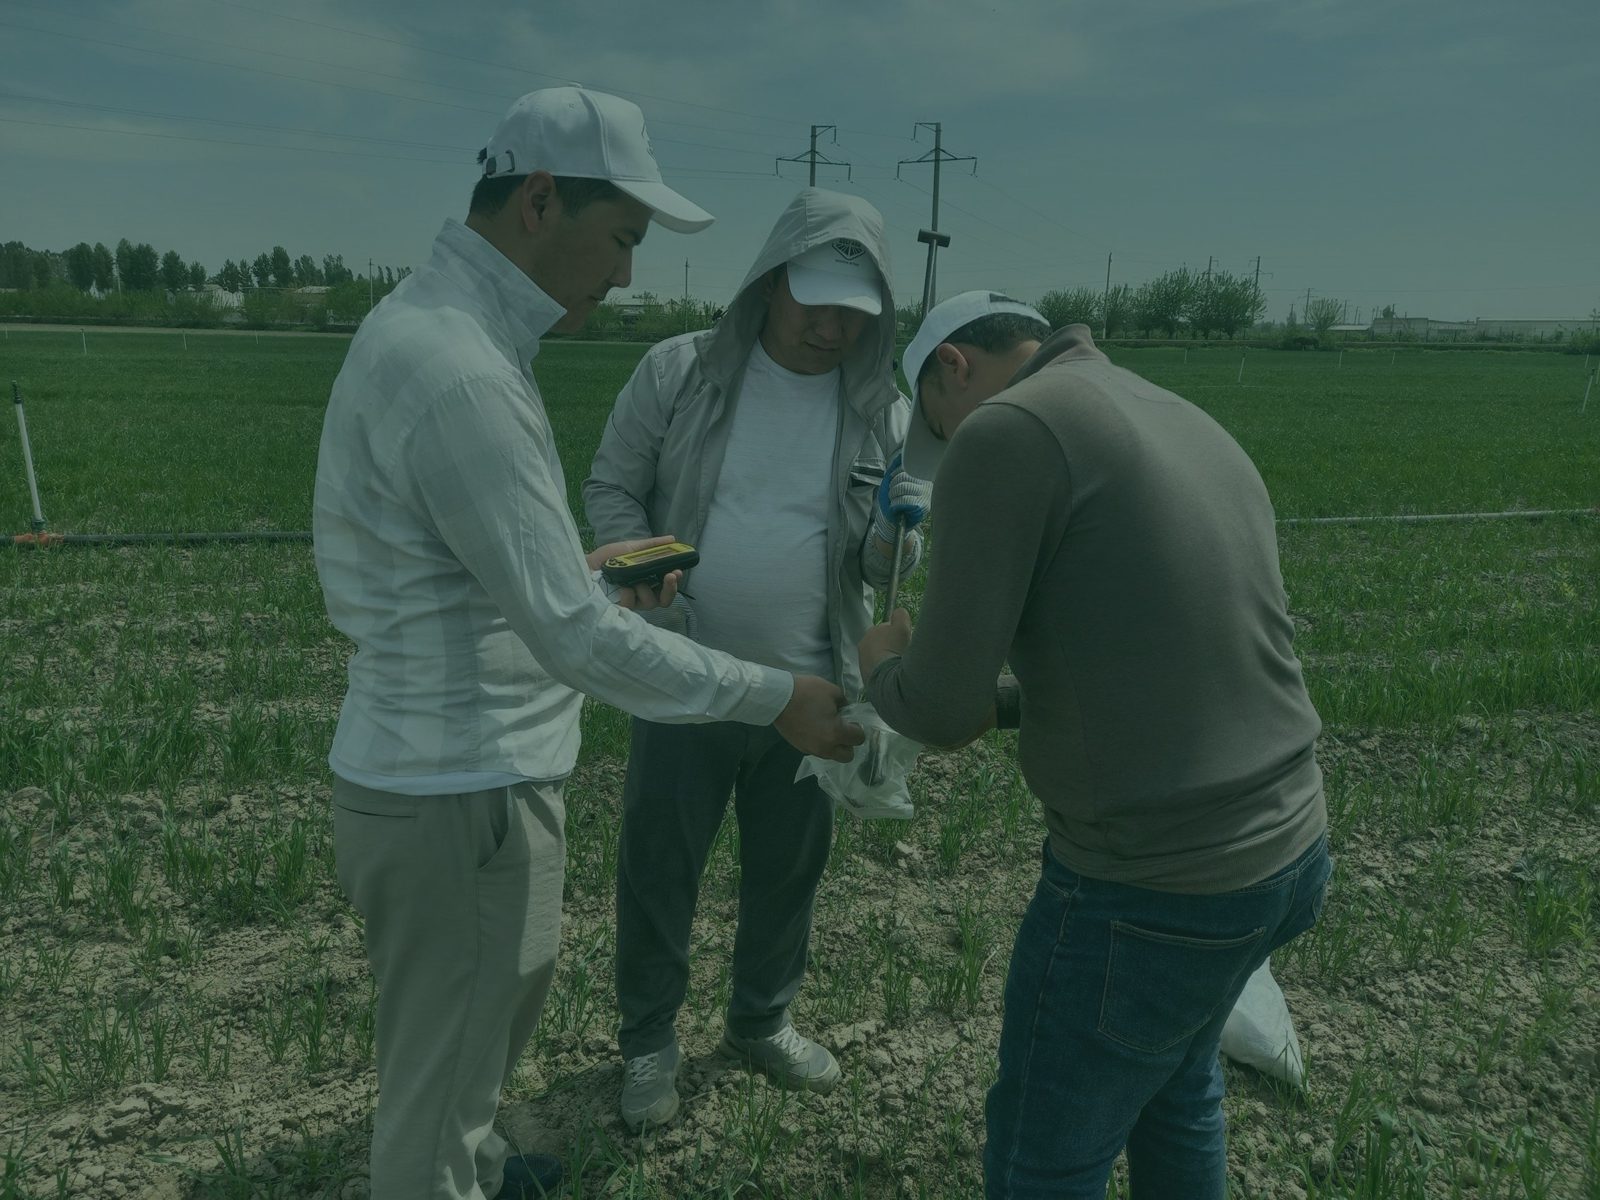
Participants
Leadership and leading researchers
Senior researchers
Junior researchers
Engineers
International partner scientists
Get in touch
Mamanbek Reymov
PhD, Associate Professor
TIIAME National Research University
- E-mailmaman1990@mail.ru
- Address39 Qori Niyoziy Street, Tashkent 100000, Uzbekistan
- Websitesocfarm.tiiame.uz